Fig. 4
Download original image
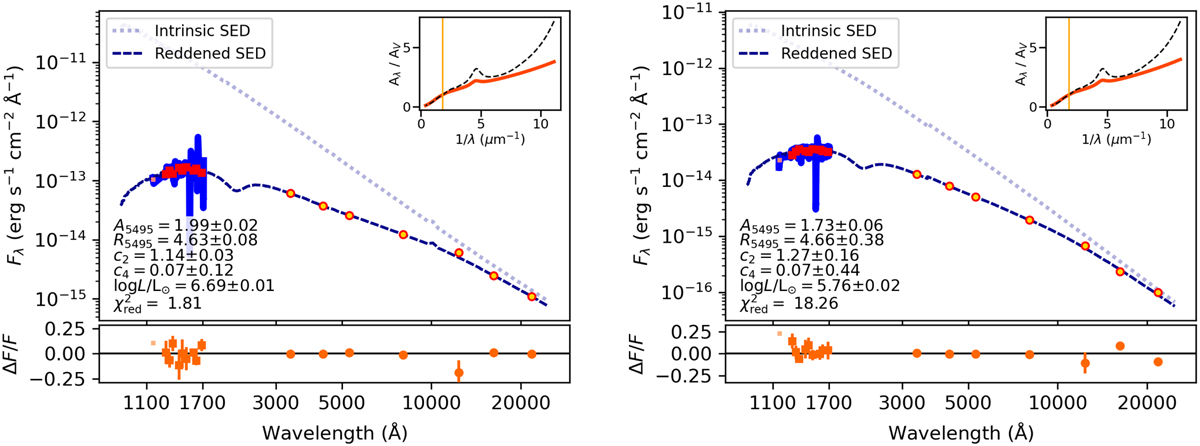
Example fits of the stars R136a3 (WN5h; left) and H55 (O2 V((f*))z; right). In the upper part of each panel, we show the photometric points that were used for the fitting; with red solid squares and yellow filled circles indicating points in the UV and optical or NIR, respectively. The thick solid blue line in the background shows the UV spectroscopy from which the UV photometric points were derived. The light blue dotted and dark blue dashed lines in the top panels show the adopted intrinsic SED, and the reddened SED (resulting from the fitting process), respectively. The lower panel shows residuals, and the best-fit parameters are printed in the upper panel. Lastly, each panel contains an inset where the shape of the extinction curve under consideration (solid orange line) is compared to the Galactic curve of Cardelli et al. (1989, RV = 3.1; black dashed line).
Current usage metrics show cumulative count of Article Views (full-text article views including HTML views, PDF and ePub downloads, according to the available data) and Abstracts Views on Vision4Press platform.
Data correspond to usage on the plateform after 2015. The current usage metrics is available 48-96 hours after online publication and is updated daily on week days.
Initial download of the metrics may take a while.