Fig. 2
Download original image
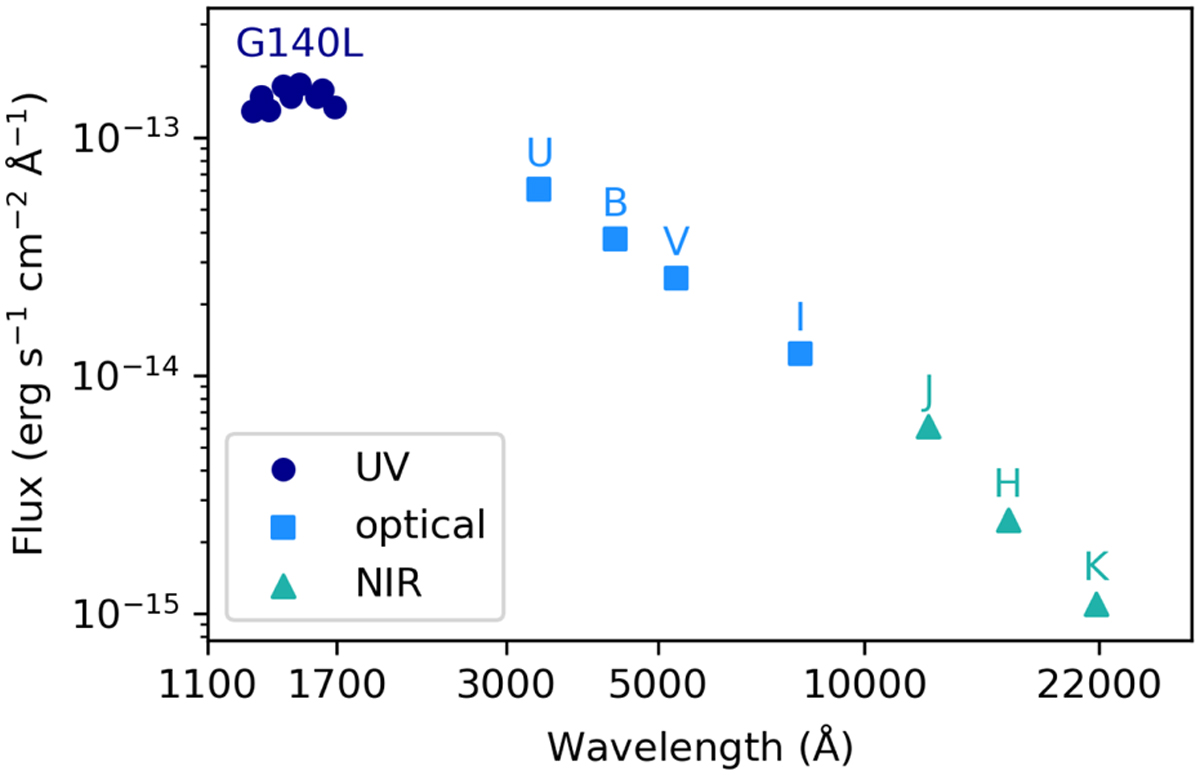
Example of an observed SED (source: R136a3) covering the UV (dark blue circles), optical (light blue squares), and NIR (turquoise triangles). The UV flux points are derived from flux-calibrated STIS spectroscopy (grating: G140L), and the optical and NIR fluxes come from broadband photometry; the (equivalent) name of each band is indicated.
Current usage metrics show cumulative count of Article Views (full-text article views including HTML views, PDF and ePub downloads, according to the available data) and Abstracts Views on Vision4Press platform.
Data correspond to usage on the plateform after 2015. The current usage metrics is available 48-96 hours after online publication and is updated daily on week days.
Initial download of the metrics may take a while.