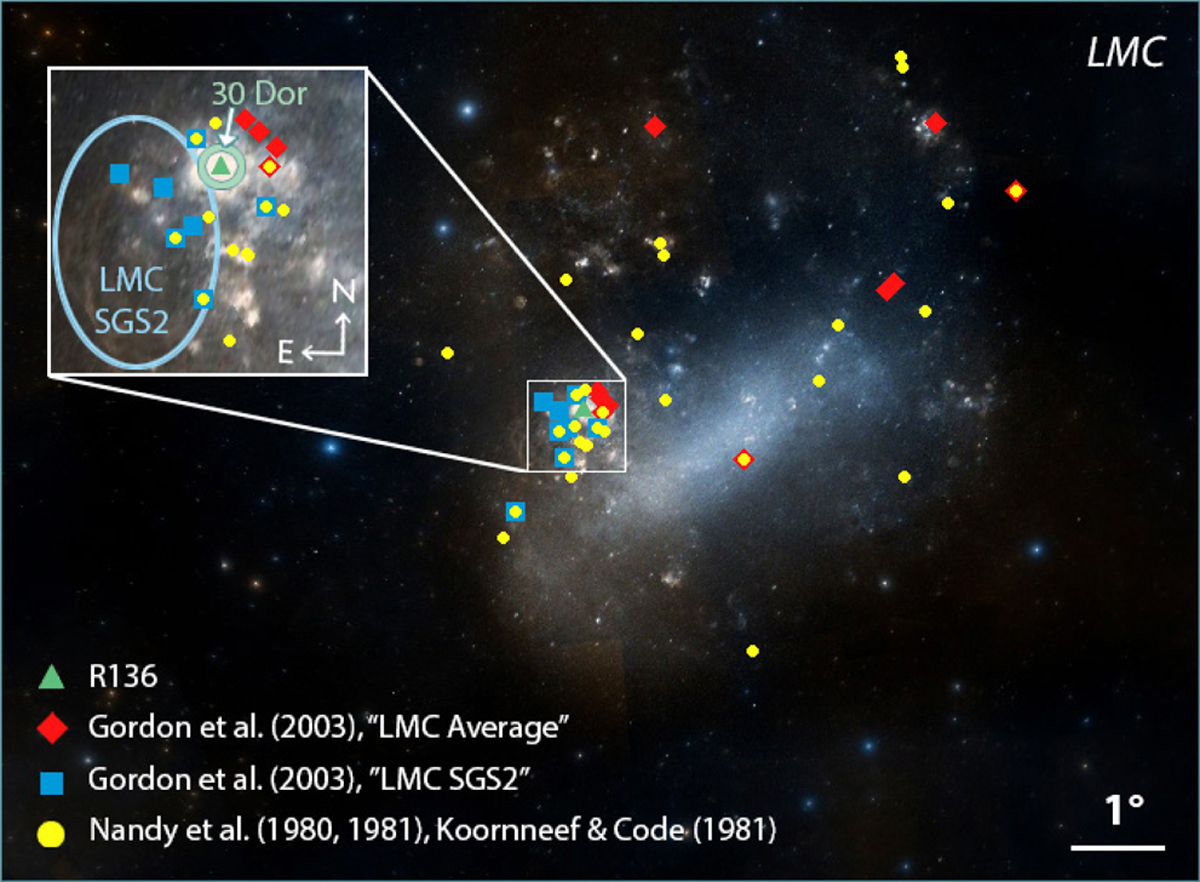
Fig. 12
Download original image
Position of stars of different samples that were used to derive extinction curves towards the LMC. The samples of Nandy et al. (1980, 1981) and Koornneef & Code (1981, yellow circles) were used to construct the curves of Howarth (1983) and Pei (1992). Gordon et al. (2003) split their sample into two and derive a separate curve for each, referring to one sample as LMC2 (LMC SGS 2, blue squares) and the other as ‘LMC Average’ (red diamonds). The green triangle denotes the position of R136. This figure was made with use of the Aladin Sky Atlas (Bonnarel et al. 2000); the background consists of DSS2 colour images.
Current usage metrics show cumulative count of Article Views (full-text article views including HTML views, PDF and ePub downloads, according to the available data) and Abstracts Views on Vision4Press platform.
Data correspond to usage on the plateform after 2015. The current usage metrics is available 48-96 hours after online publication and is updated daily on week days.
Initial download of the metrics may take a while.