Fig. 11
Download original image
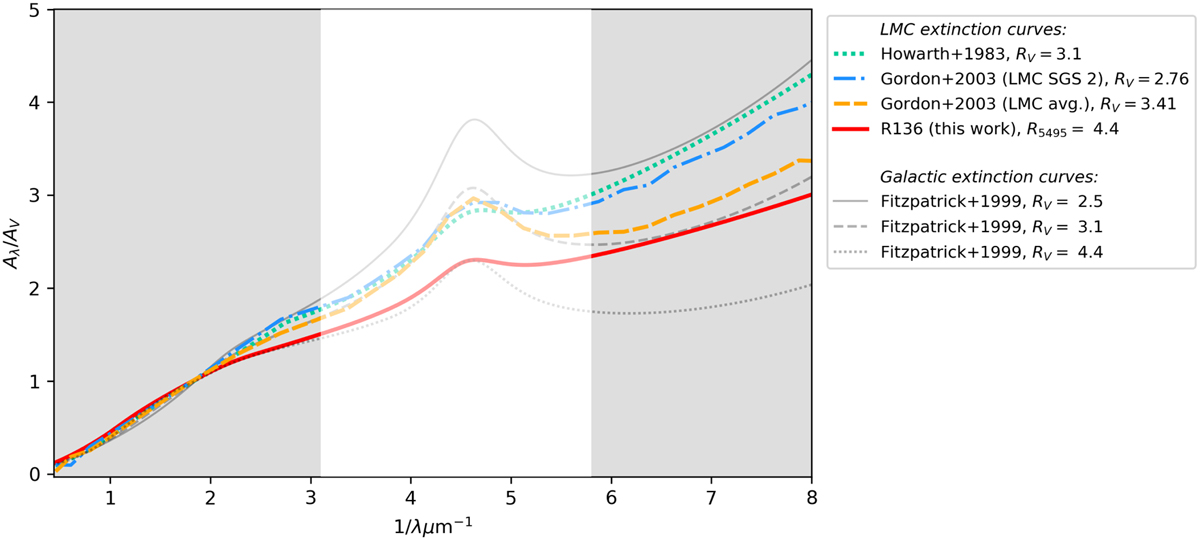
Comparison of extinction curves tailored to (specific regions within) the LMC. Shown are the average extinction curve of Howarth (1983, green dotted line), which is nearly equal to that of Pei (1992, not shown) and two curves of Gordon et al. (2003), based on samples within LMC SGS 2 (blue dash-dotted line), and a sample in other parts of the LMC (‘LMC avg.’, orange dashed line). We compare these curves to the average curve derived in this work, which we show for R5495 = 4.4 (the average value towards R136; red solid line). For reference, we also show the Galactic curve of Fitzpatrick (1999) for different values of RV (grey lines). The grey areas indicate parts of the SED that we analysed in this work. The white area contains the 2175 Å feature, a wavelength region that was not covered by our data; the extinction curves are also shown in this wavelength range for completeness, but we highlight the fact that the bump parameters of our R136 curve are simply taken from the LMC SGS 2 curve of Gordon et al. (2003).
Current usage metrics show cumulative count of Article Views (full-text article views including HTML views, PDF and ePub downloads, according to the available data) and Abstracts Views on Vision4Press platform.
Data correspond to usage on the plateform after 2015. The current usage metrics is available 48-96 hours after online publication and is updated daily on week days.
Initial download of the metrics may take a while.