Fig. 10
Download original image
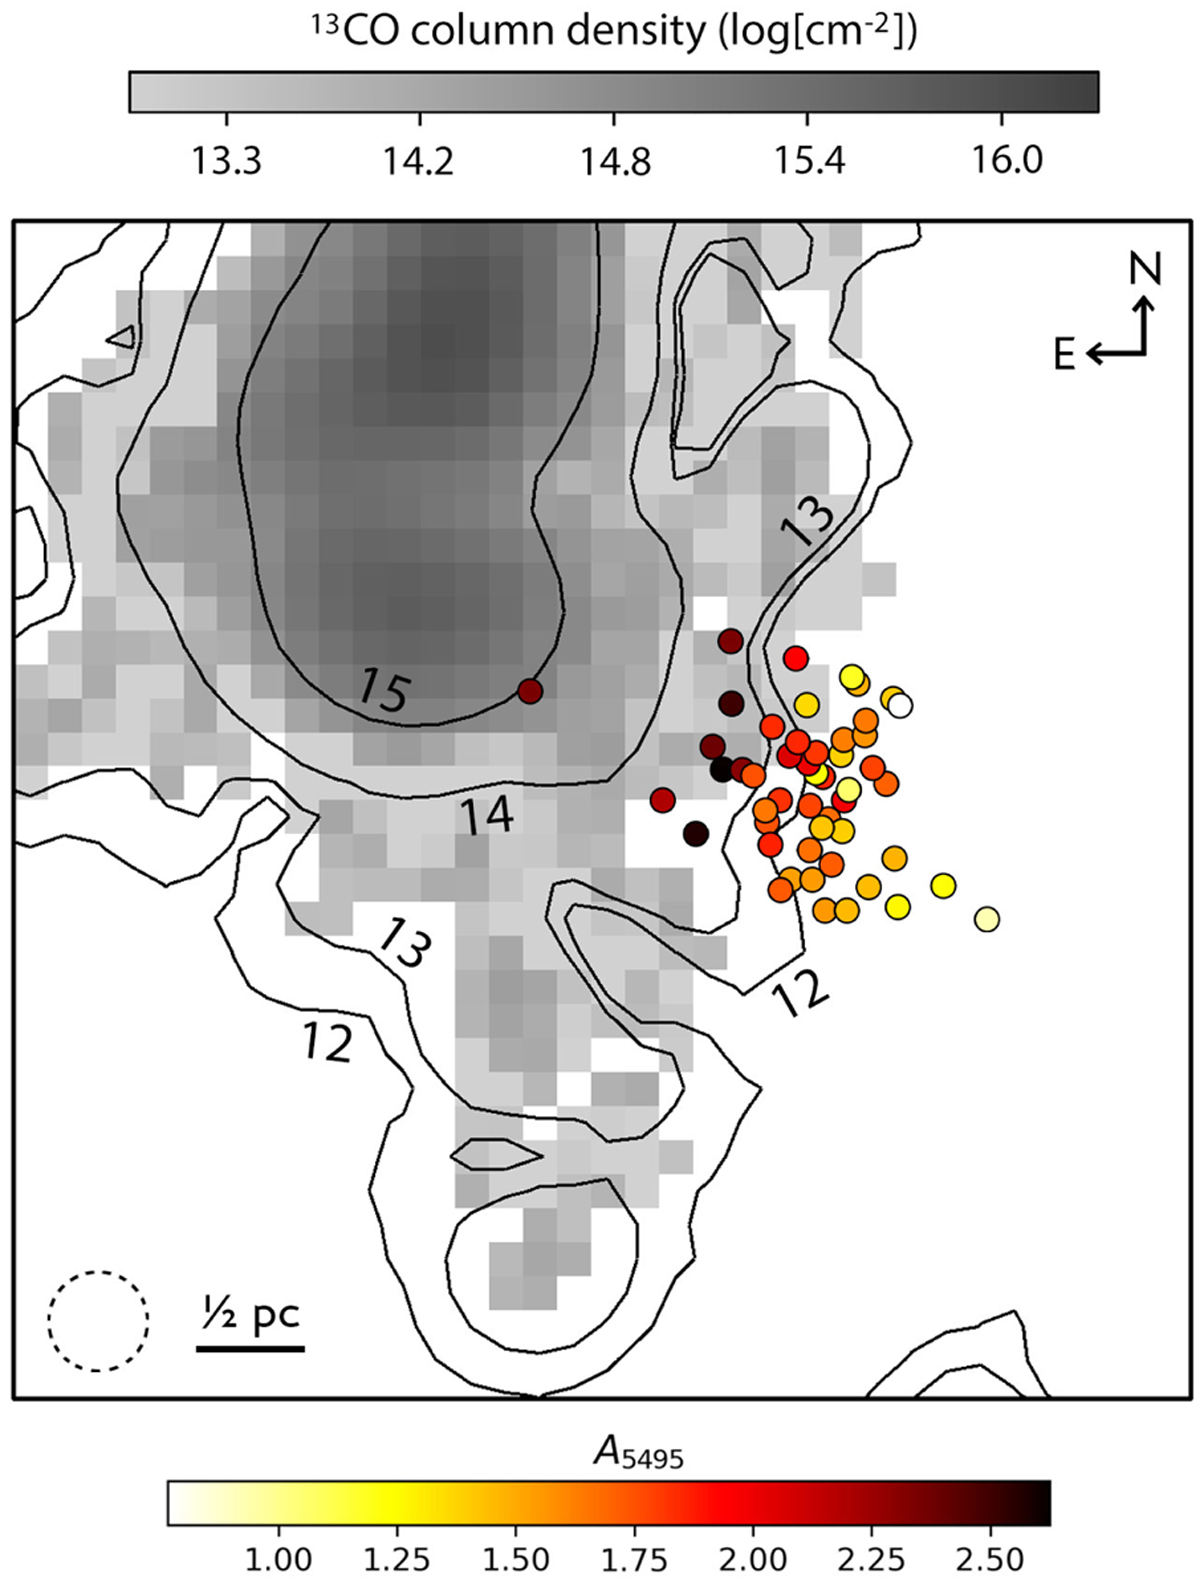
13CO column density map of R136 and surroundings, obtained with ALMA (Wong et al. 2022). Darker regions indicate a higher 13CO column density; in white regions no 13CO was detected. Contours, created with DS9 (smoothing = 4), correspond to lines of constant13CO column density, the value of which is indicated in the plot in units of log[cm−2]. The dashed circle in the lower left corner of the image indicates the beam size. Small filled circles indicate the positions of the stars in the R136 core; the colour of each circle corresponds to the measured extinction, with darker colours corresponding to a higher extinction. Comparing the extinction of the R136 core stars with the 13CO map, we see that in regions where13 CO is detected we measure stronger extinction.
Current usage metrics show cumulative count of Article Views (full-text article views including HTML views, PDF and ePub downloads, according to the available data) and Abstracts Views on Vision4Press platform.
Data correspond to usage on the plateform after 2015. The current usage metrics is available 48-96 hours after online publication and is updated daily on week days.
Initial download of the metrics may take a while.