Fig. 1
Download original image
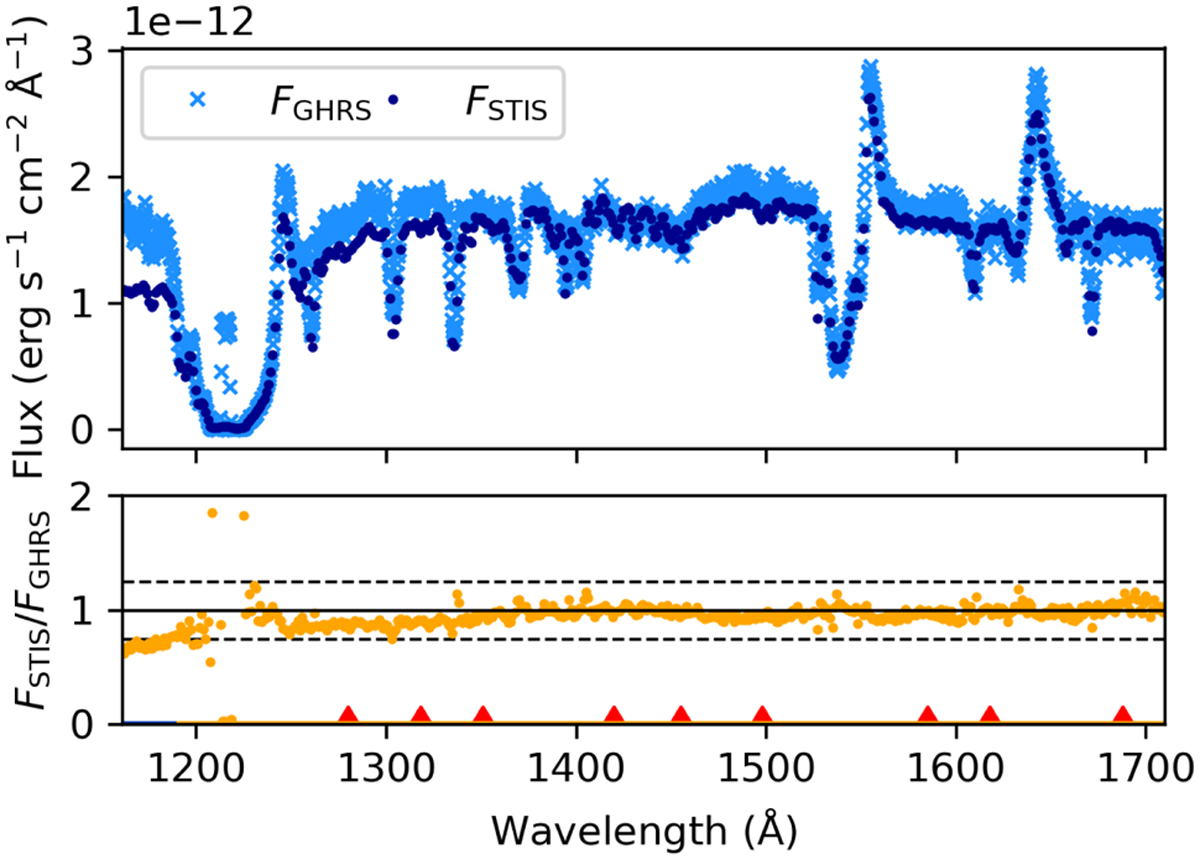
Integrated UV flux of the core of R136. The upper panel shows the GHRS spectrum of the inner 2′ × 2′ (Heap et al. 1992; light blue crosses), as well as the summed STIS spectra used in this work (dark blue circles), with both covering roughly the same inner region of the cluster. The bottom panel shows the ratio of the former two spectra (yellow dots) as well as the central wavelength of the synthetic UV bands used in this work (red triangles, see Sect. 3.1). The dashed lines correspond to ratios of 0.75 and 1.25.
Current usage metrics show cumulative count of Article Views (full-text article views including HTML views, PDF and ePub downloads, according to the available data) and Abstracts Views on Vision4Press platform.
Data correspond to usage on the plateform after 2015. The current usage metrics is available 48-96 hours after online publication and is updated daily on week days.
Initial download of the metrics may take a while.