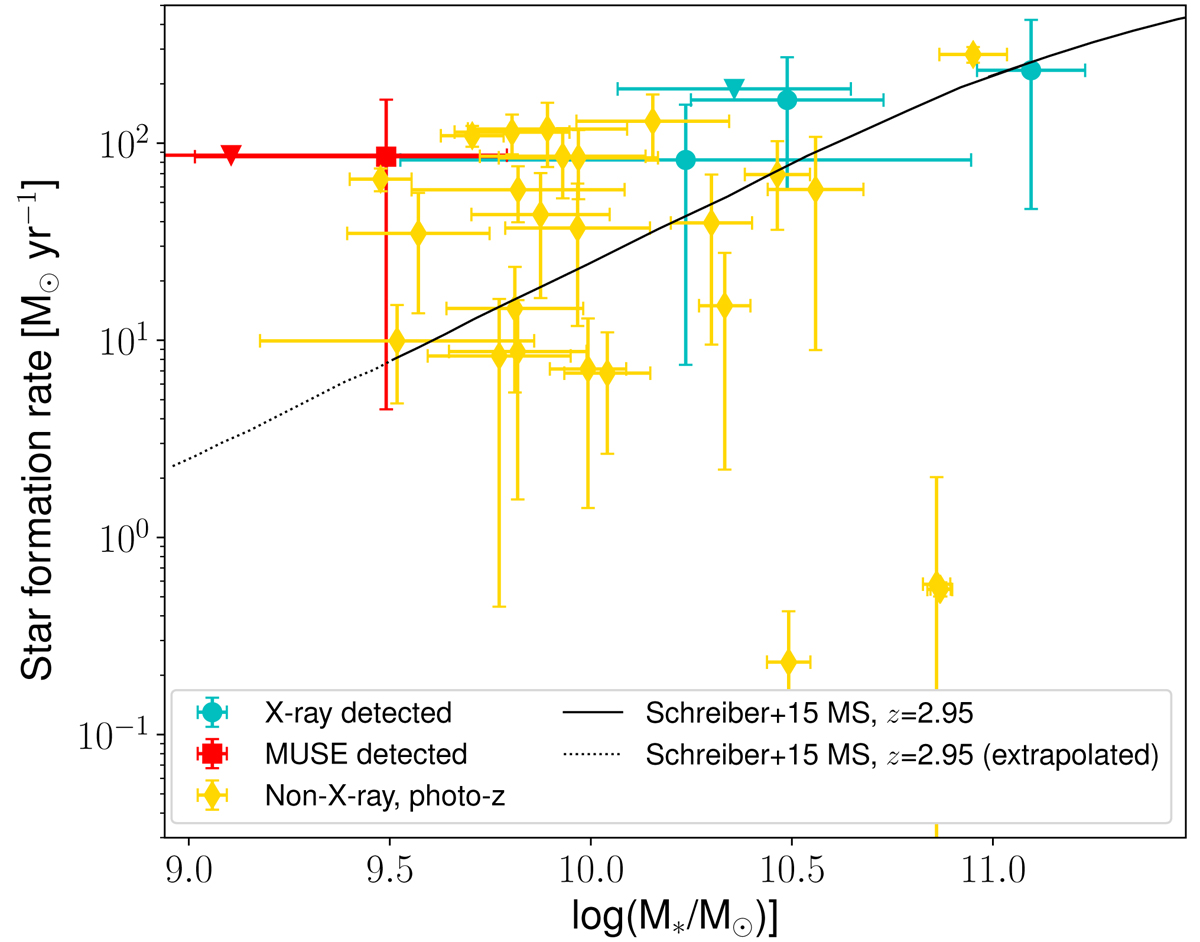
Fig. 5.
Download original image
Star formation rate as a function of stellar mass for the four X-ray detected (cyan circles) and the two MUSE-detected (red squares) members of the z ∼ 2.78 overdensity, as well as for the 26 candidate members of the overdensity with a photometric redshift of zphot = [2.68 − 2.88] (yellow diamonds). Upper limits are plotted as downwards triangles. As a reference, we also plotted the z = 2.95 main sequence from Schreiber et al. (2015). Both M* and SFR were computed through SED fitting.
Current usage metrics show cumulative count of Article Views (full-text article views including HTML views, PDF and ePub downloads, according to the available data) and Abstracts Views on Vision4Press platform.
Data correspond to usage on the plateform after 2015. The current usage metrics is available 48-96 hours after online publication and is updated daily on week days.
Initial download of the metrics may take a while.