Fig. 4.
Download original image
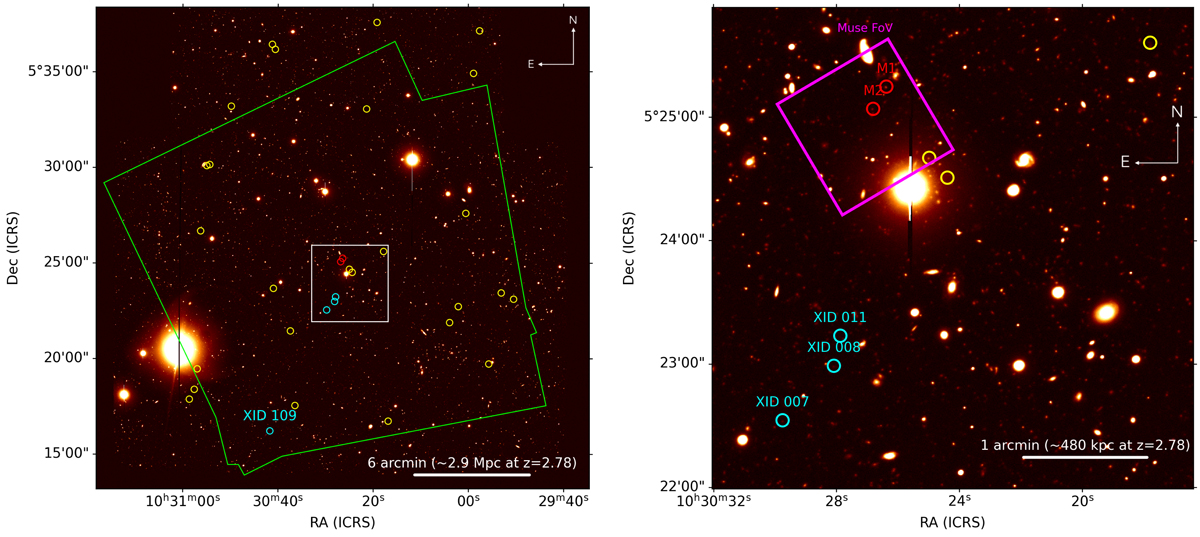
LBT-LBC r-band images of the J1030 field. Left: whole field image, with the Chandra coverage shown in green. The spectroscopically confirmed, X-ray-detected members of the z ∼ 2.78 LSS are plotted with a red circle, while the two non-X-ray-detected sources with a MUSE spectroscopic redshift are plotted in red. Non-X-ray sources with a photometric redshift in the range zphot = [2.68 − 2.88] are plotted as yellow circles. Right: Inset of the ∼4′ × 4′ region (shown as a white box in the left panel) where we detected five out of six members of the LSS. The MUSE coverage of the J1030 field is also shown here for reference.
Current usage metrics show cumulative count of Article Views (full-text article views including HTML views, PDF and ePub downloads, according to the available data) and Abstracts Views on Vision4Press platform.
Data correspond to usage on the plateform after 2015. The current usage metrics is available 48-96 hours after online publication and is updated daily on week days.
Initial download of the metrics may take a while.