Fig. 2.
Download original image
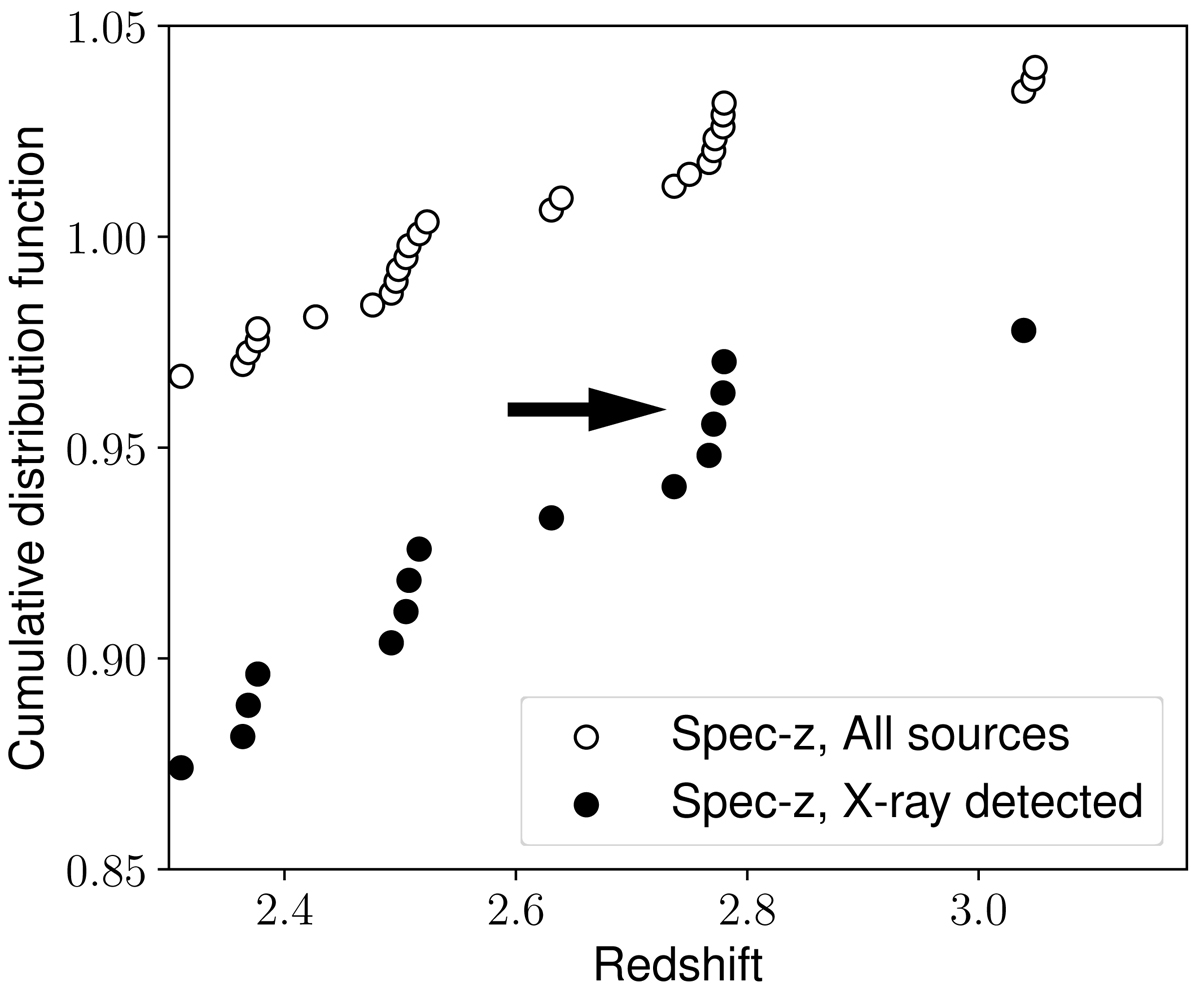
Redshift cumulative distribution function around z = 2.78 for the Chandra J1030 sources with a spectroscopic redshift (full markers), and for all the J1030 sources with a spectroscopic redshift, including the non-X-ray-detected ones (empty markers). The overall cumulative distribution function has been shifted by 0.1 for visualization purposes. The z ∼ 2.78 structure is marked with an arrow. Other two potential structures can be observed at z ∼ 2.37 and z ∼ 2.51 (see the text for more details).
Current usage metrics show cumulative count of Article Views (full-text article views including HTML views, PDF and ePub downloads, according to the available data) and Abstracts Views on Vision4Press platform.
Data correspond to usage on the plateform after 2015. The current usage metrics is available 48-96 hours after online publication and is updated daily on week days.
Initial download of the metrics may take a while.