Fig. 9
Download original image
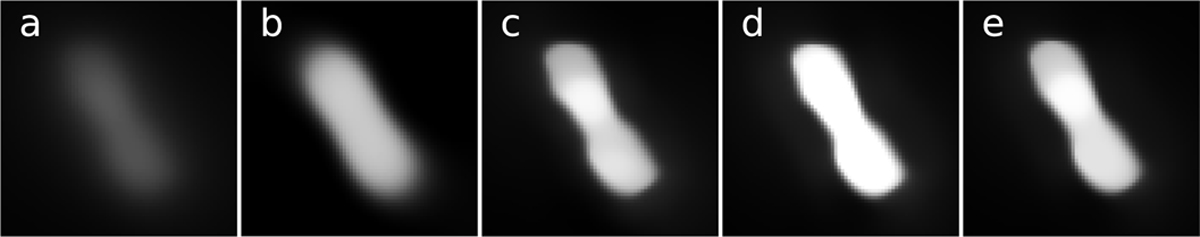
Observation and the deconvolutions with different PSFs. (a) Observation, (b) Deconvolution performed using the PSF estimated using a previous model Conan et al. (1998). (c) Deconvolution using the estimation with the elliptical model, (d) Deconvolution using the calibration star observed after the observation, (e) Deconvolution by Marchis et al. (2021) using a Moffat PSF profile. These images are plotted with the same intensity scale.
Current usage metrics show cumulative count of Article Views (full-text article views including HTML views, PDF and ePub downloads, according to the available data) and Abstracts Views on Vision4Press platform.
Data correspond to usage on the plateform after 2015. The current usage metrics is available 48-96 hours after online publication and is updated daily on week days.
Initial download of the metrics may take a while.