Fig. 3
Download original image
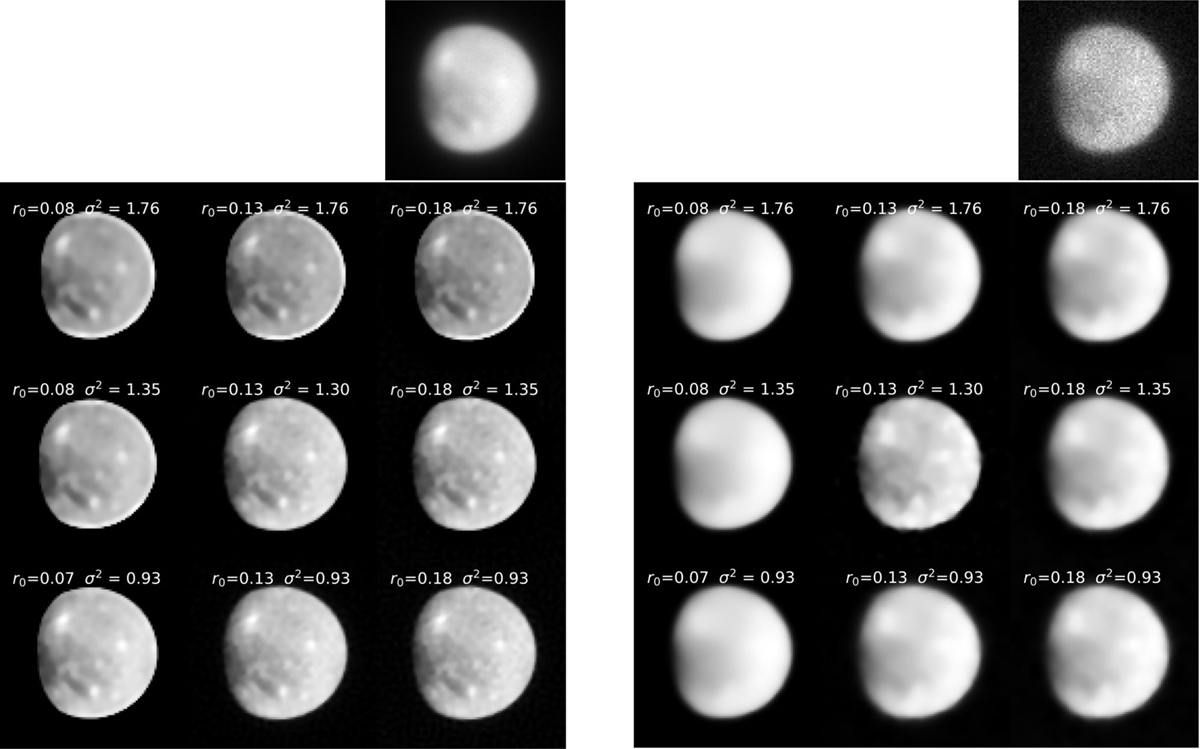
Simulated images produced from deconvolutions of the objects shown schematically in Fig. 2. The simulated image before deconvolution is shown in the top right corner of each panel of nine images. Left: deconvolved objects marked by the diamond symbols in the top left of Fig. 2 with high S/N (=100), right: deconvolved objects marked by the diamond symbols in the top right of Fig. 2 with low S/N (=10).
Current usage metrics show cumulative count of Article Views (full-text article views including HTML views, PDF and ePub downloads, according to the available data) and Abstracts Views on Vision4Press platform.
Data correspond to usage on the plateform after 2015. The current usage metrics is available 48-96 hours after online publication and is updated daily on week days.
Initial download of the metrics may take a while.