Fig. 2
Download original image
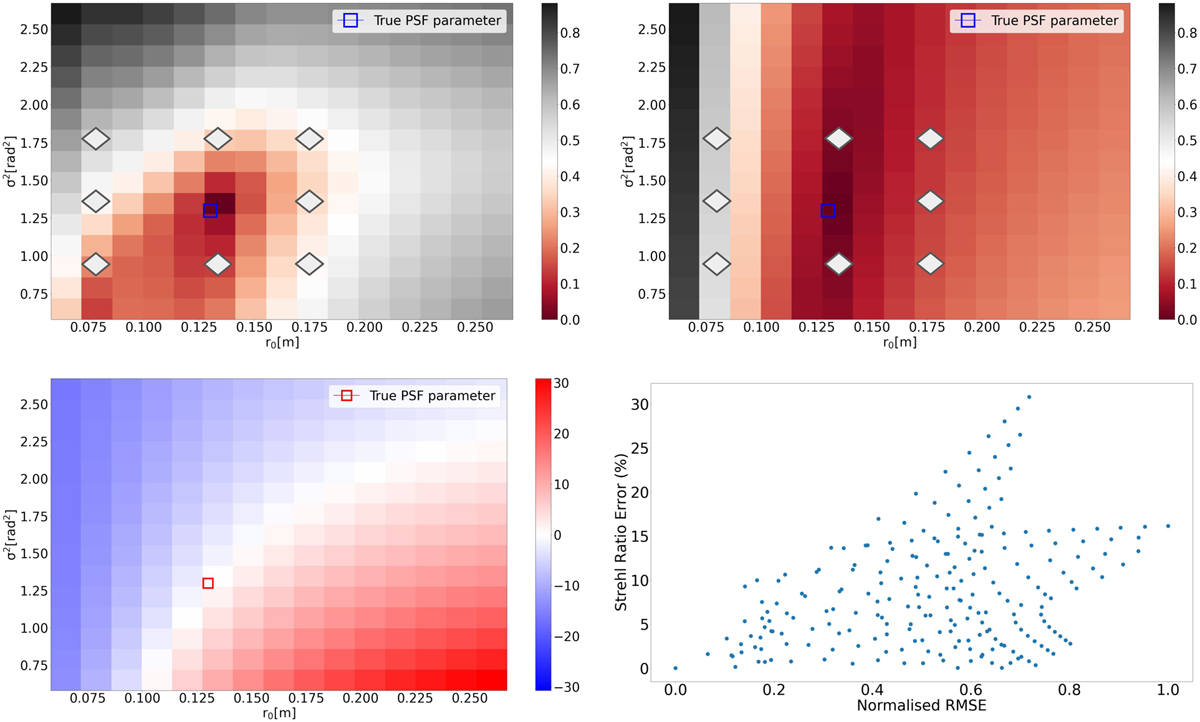
Deconvolution sensitivity with two different S/Ns. Top left: Deconvolution RMSE with high S/N = 100. Top right: deconvolution RMSE with low S/N = 10. The colour intensity represents the strength of the RMSE. Redder colour in the RMSE map corresponds to lower RMSE values. The square represents the true PSF parameter and the diamond symbols represent the visual results displayed in Fig. 3. Bottom left: Strehl ratio error with the PSF parameters in the deconvolution RMSE map. Bottom right: Strehl ratio error versus normalised RMSE in the deconvolution RMSE map with a high S/N.
Current usage metrics show cumulative count of Article Views (full-text article views including HTML views, PDF and ePub downloads, according to the available data) and Abstracts Views on Vision4Press platform.
Data correspond to usage on the plateform after 2015. The current usage metrics is available 48-96 hours after online publication and is updated daily on week days.
Initial download of the metrics may take a while.