Fig. 11
Download original image
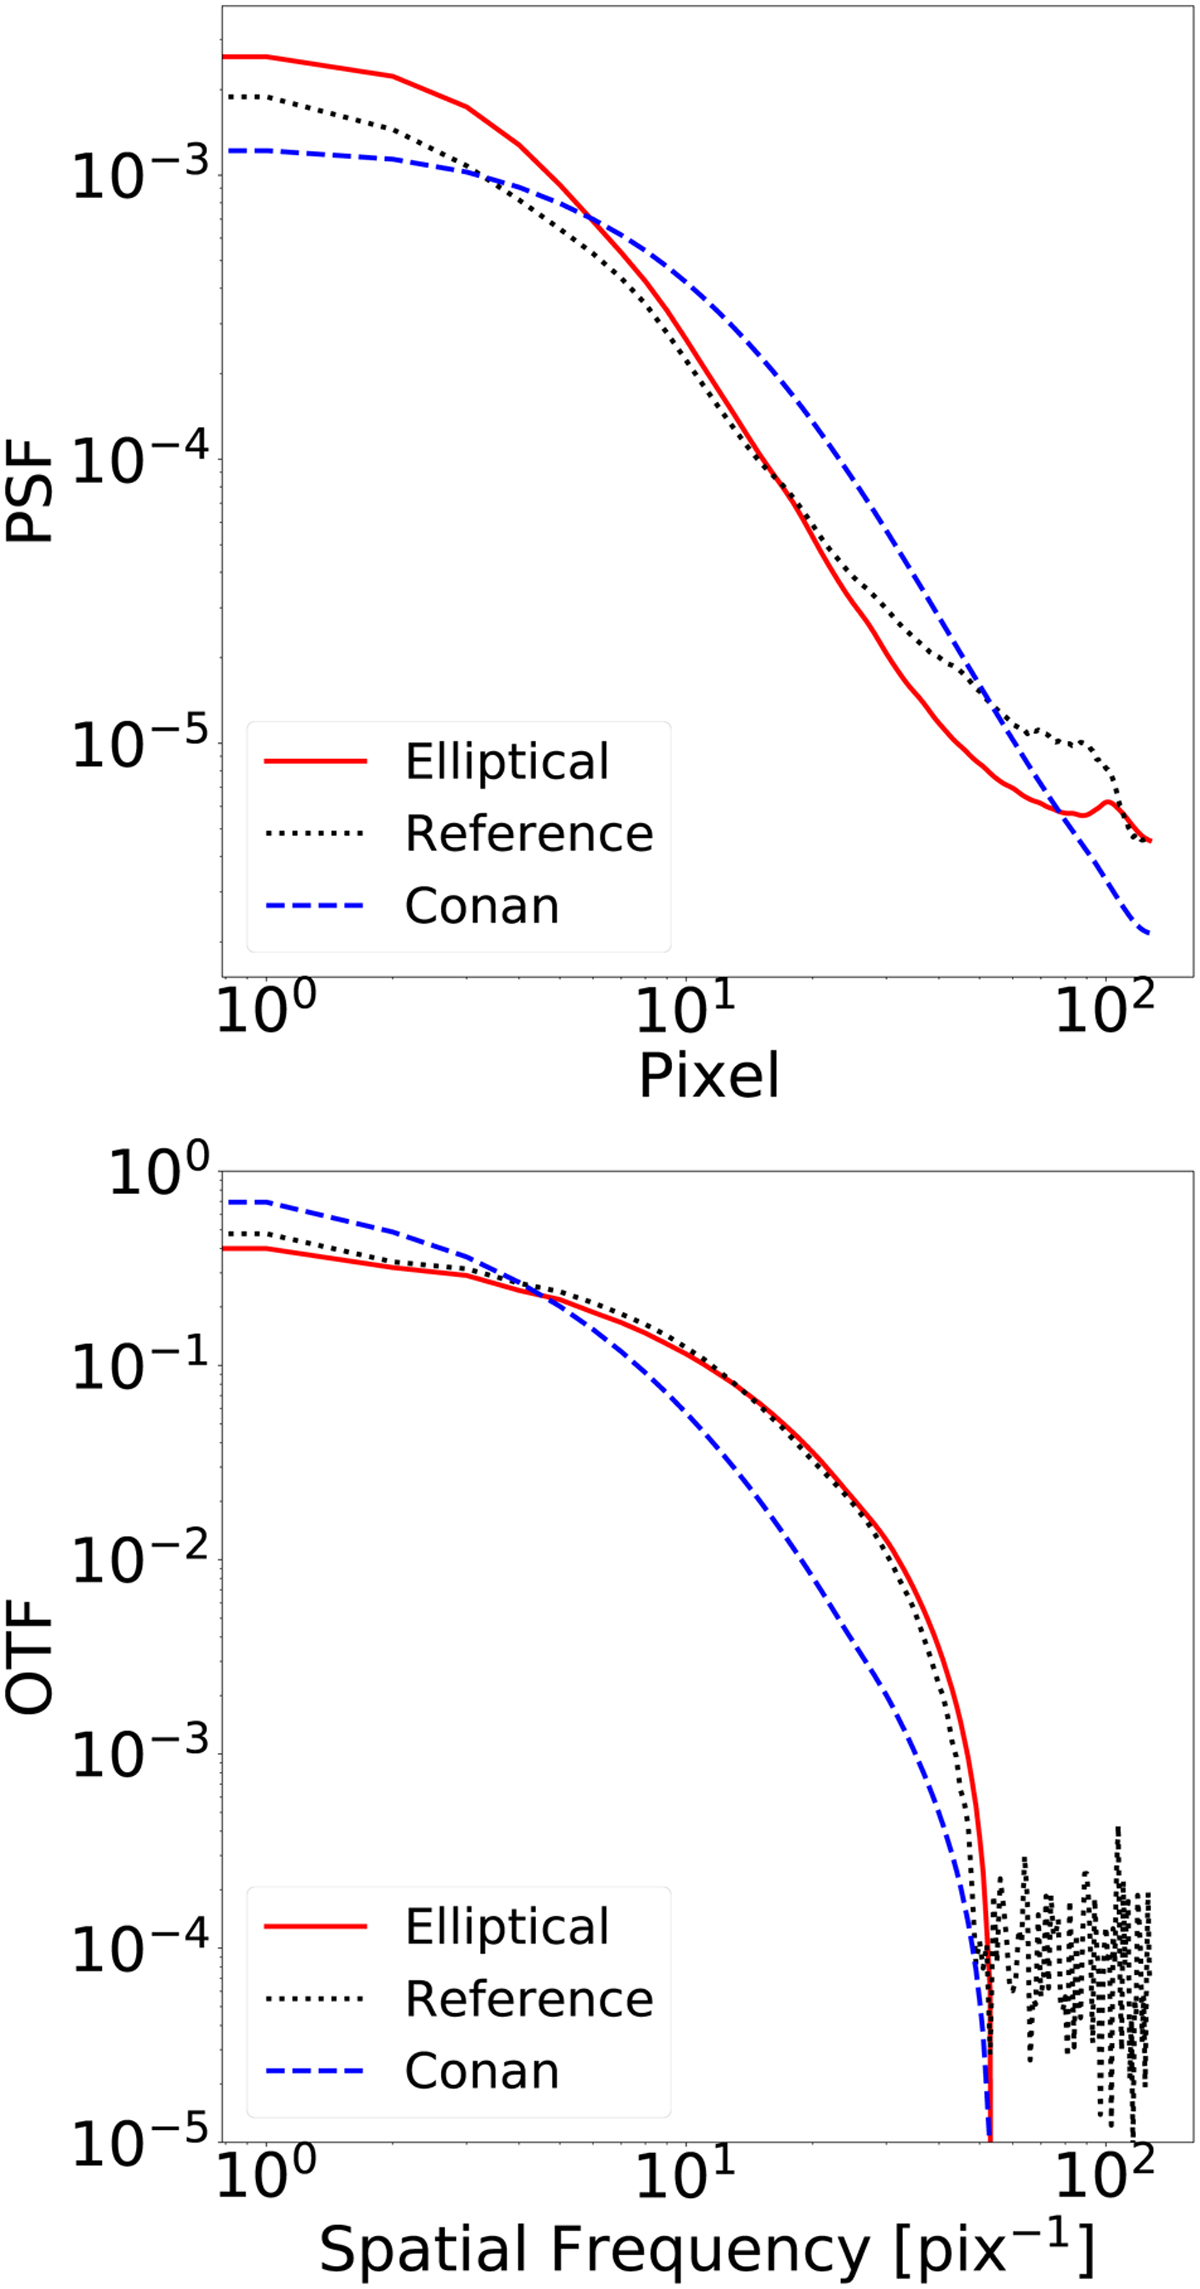
PSFs and OTF profiles used for deconvolution. Top: cut of the PSFs and the reference PSF. The PSF estimated with by Conan et al. (1998) is shown with a blue dashed line, the PSF estimated with the elliptical model is shown with a red solid line, and the reference PSF obtained after the observation is shown as a black dotted line. Bottom: cut of the OTFs and the reference OTF. The OTF estimated by Conan et al. (1998) is shown as a blue dashed line, the OTF estimated with the elliptical model is shown as a red solid line, and the reference OTF obtained after the observation is shown as a black dotted line.
Current usage metrics show cumulative count of Article Views (full-text article views including HTML views, PDF and ePub downloads, according to the available data) and Abstracts Views on Vision4Press platform.
Data correspond to usage on the plateform after 2015. The current usage metrics is available 48-96 hours after online publication and is updated daily on week days.
Initial download of the metrics may take a while.