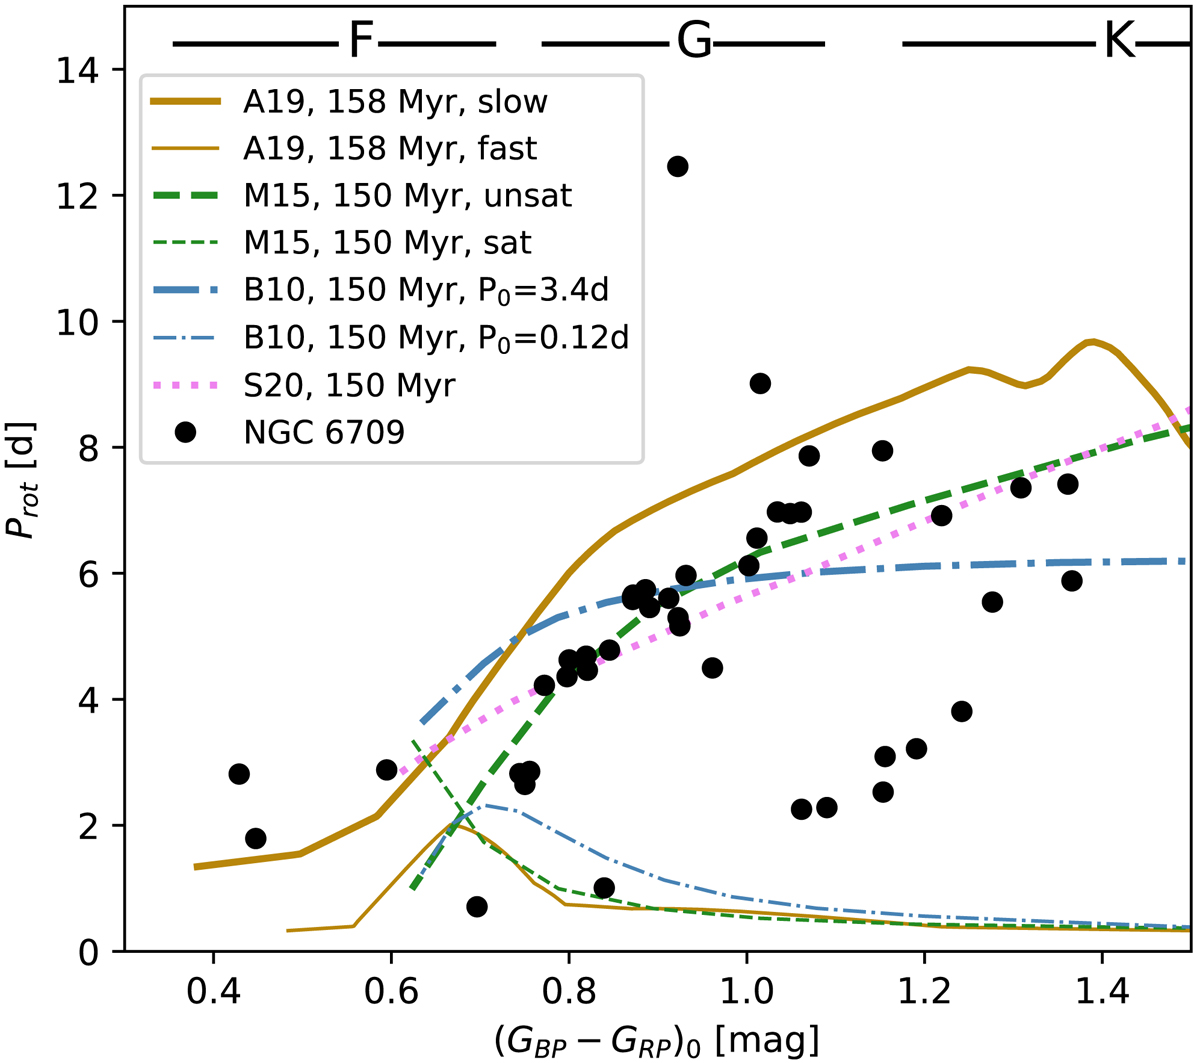
Fig. 5.
Download original image
Rotation periods versus (GBP − GRP)0 for cluster members and comparison to models. A19 refers to the model by Amard et al. (2019), where both the sequences for initially slow and fast rotators are shown by solid and dashed lines, respectively. M15 is the model of Matt et al. (2015) with the unsaturated and saturated regimes indicated by solid and dotted lines, respectively. B10 is the model of Barnes & Kim (2010), with the solid and dashed lines again denoting initially slow and fast rotators. S20 is the model of Spada & Lanzafame (2020).
Current usage metrics show cumulative count of Article Views (full-text article views including HTML views, PDF and ePub downloads, according to the available data) and Abstracts Views on Vision4Press platform.
Data correspond to usage on the plateform after 2015. The current usage metrics is available 48-96 hours after online publication and is updated daily on week days.
Initial download of the metrics may take a while.