Fig. 2.
Download original image
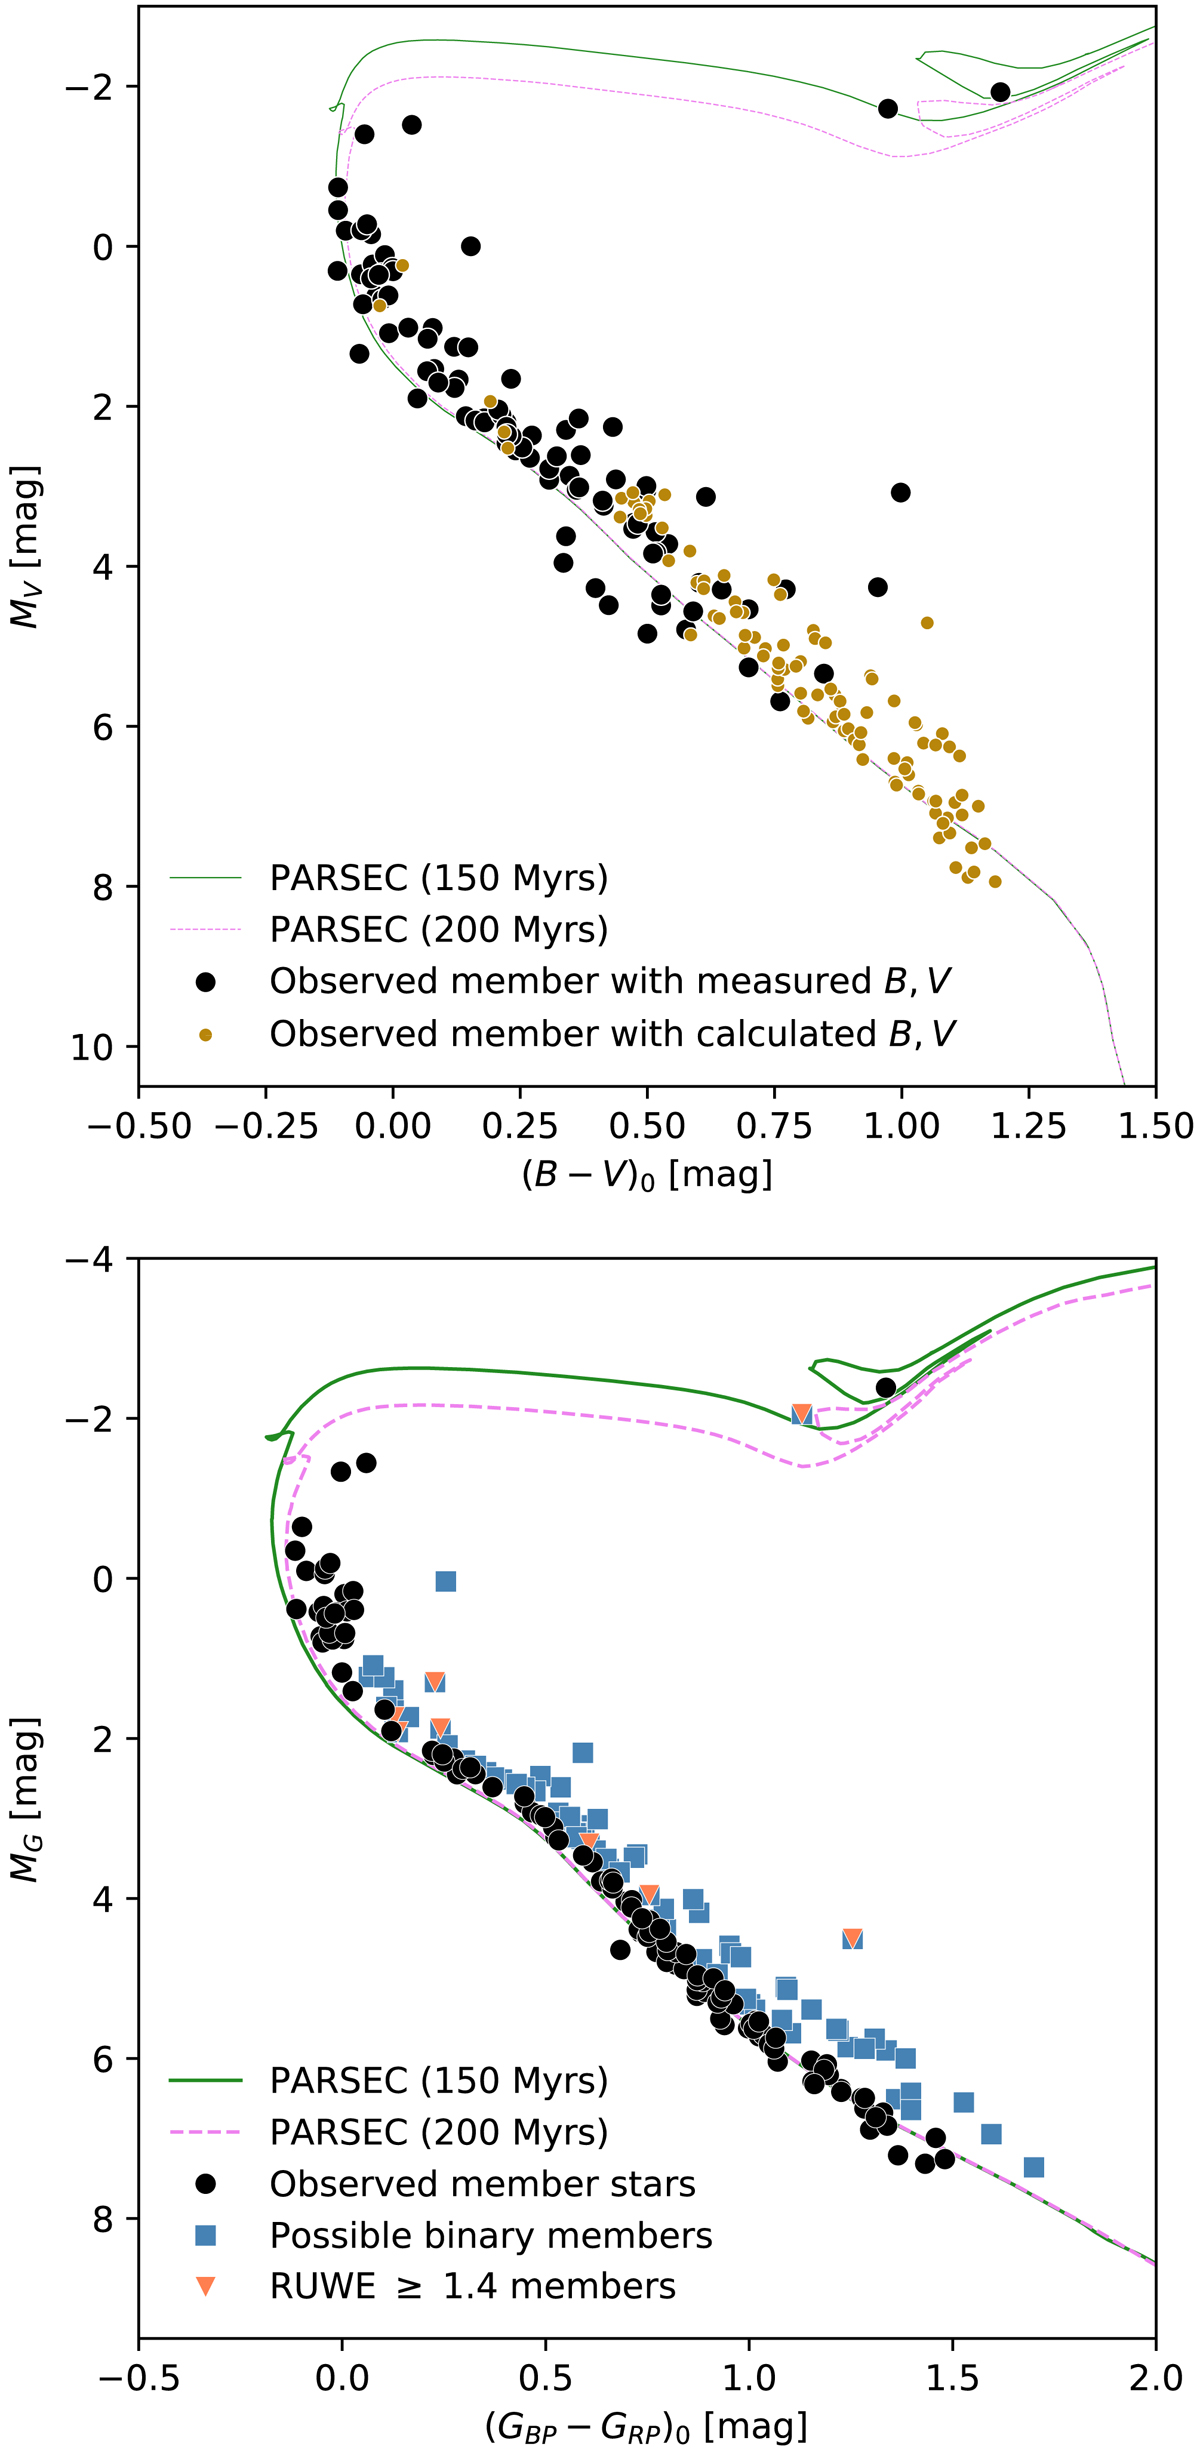
Color magnitude diagrams for NGC 6709 in B − V (above), and Gaia color (below). PARSEC isochrones for 150 Myr and 200 Myr are also displayed. The line-of-sight extinction is calculated for each star using individual stellar parallaxes as measured by Gaia instead of the mean cluster distance. Calculated (B − V)0 from Gaia colors are shown by small gold dots (above). Possible photometric binaries are indicated in blue and RUWE-value binaries are indicated by orange triangles (below).
Current usage metrics show cumulative count of Article Views (full-text article views including HTML views, PDF and ePub downloads, according to the available data) and Abstracts Views on Vision4Press platform.
Data correspond to usage on the plateform after 2015. The current usage metrics is available 48-96 hours after online publication and is updated daily on week days.
Initial download of the metrics may take a while.