Fig. 9.
Download original image
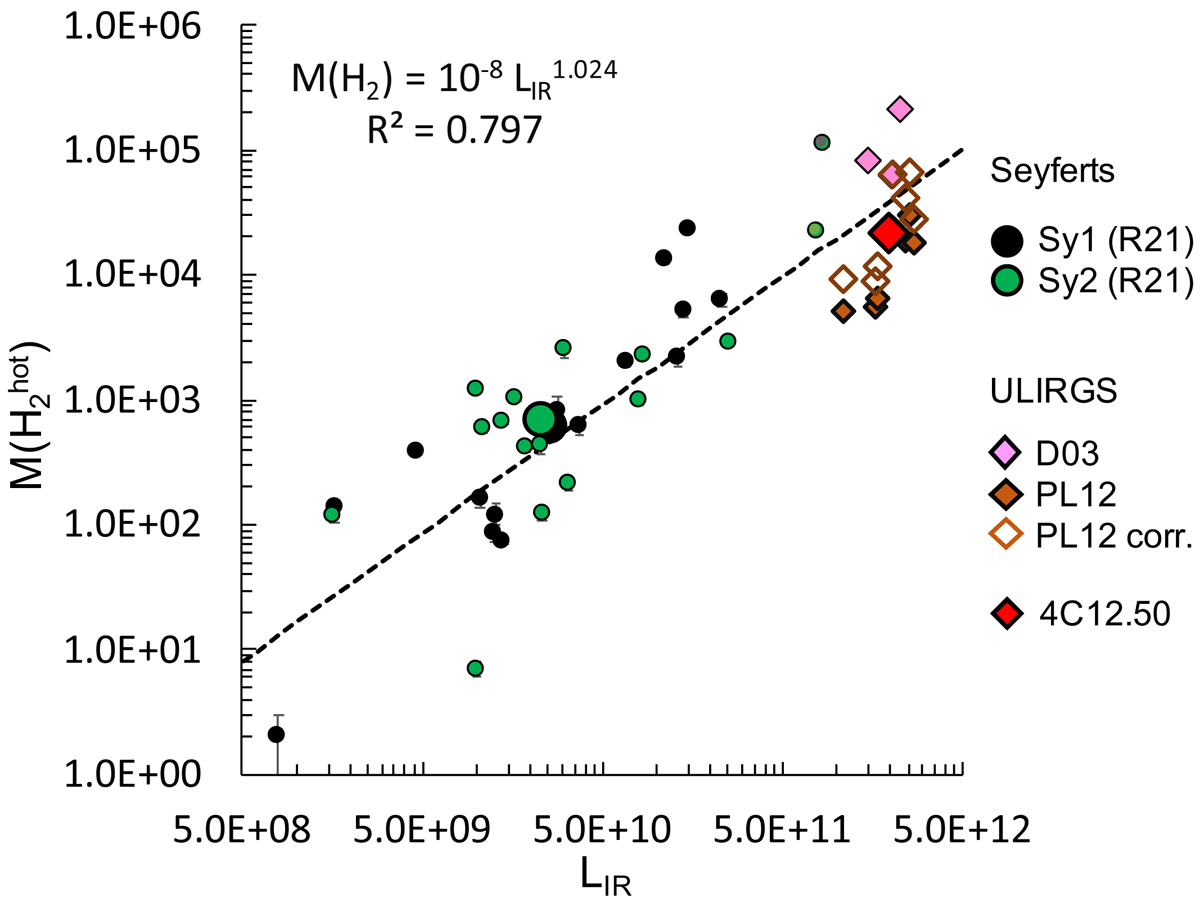
![]() in units of M⊙ vs. the 8–1000 μm infrared luminosity LIR in units of L⊙. The objects are Sy1 and Sy2 from R21 (Riffel et al. 2021) and ULIRGs from D03 (Davies et al. 2003) and PL12 (Piqueras López et al. 2012). No extinction correction has been applied, except for PL12 ULIRGs (open orange diamonds; PL12 corr.). The same extinction as the ionised gas has been assumed (Piqueras López et al. 2013). 4C12.50 is plotted as a red diamond. The observed and extinction corrected masses are very similar in this case. The size of the symbol is similar to the errorbar. The large black and green solid circles (in an almost identical location) are the median of the Sy1 (small black circles) and Sy2 (small green circles) values. The dotted black line shows the best fit to all solid data points (this is, the masses not corrected for extinction).
in units of M⊙ vs. the 8–1000 μm infrared luminosity LIR in units of L⊙. The objects are Sy1 and Sy2 from R21 (Riffel et al. 2021) and ULIRGs from D03 (Davies et al. 2003) and PL12 (Piqueras López et al. 2012). No extinction correction has been applied, except for PL12 ULIRGs (open orange diamonds; PL12 corr.). The same extinction as the ionised gas has been assumed (Piqueras López et al. 2013). 4C12.50 is plotted as a red diamond. The observed and extinction corrected masses are very similar in this case. The size of the symbol is similar to the errorbar. The large black and green solid circles (in an almost identical location) are the median of the Sy1 (small black circles) and Sy2 (small green circles) values. The dotted black line shows the best fit to all solid data points (this is, the masses not corrected for extinction).
Current usage metrics show cumulative count of Article Views (full-text article views including HTML views, PDF and ePub downloads, according to the available data) and Abstracts Views on Vision4Press platform.
Data correspond to usage on the plateform after 2015. The current usage metrics is available 48-96 hours after online publication and is updated daily on week days.
Initial download of the metrics may take a while.