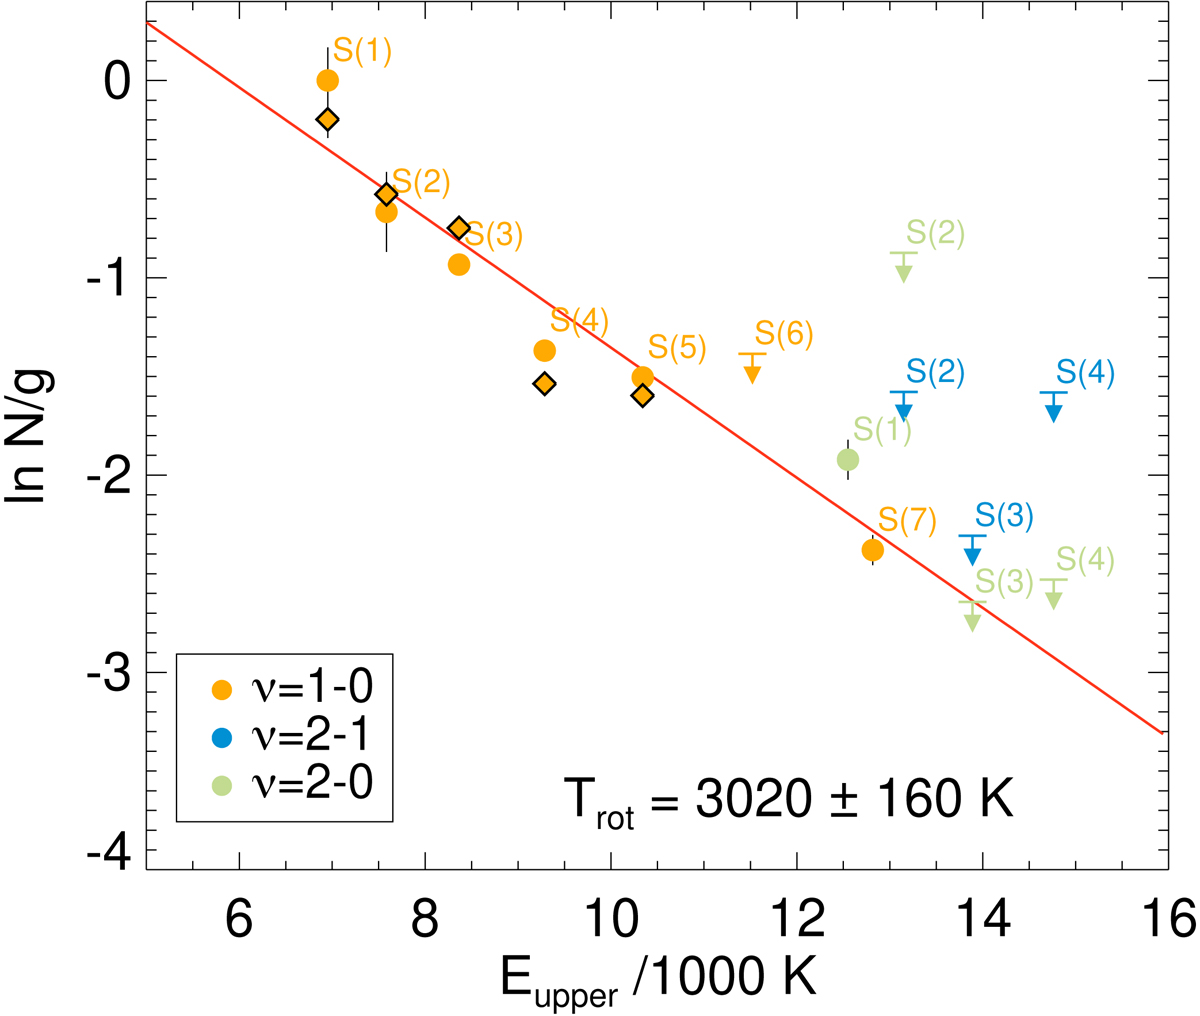
Fig. 8.
Download original image
Modelling the relative population levels of the H2 NIR transitions using single excitation-temperature LTE models. The orange circles and diamonds represent de X-shooter and EMIR measurements respectively. Upper limits were obtained with the X-shooter spectrum. They correspond to H2 1–0 S(6) λ1.7880 (orange), the 2–1 transitions (blue) S(2) λ2.1542, S(3) λ2.0729 and S(4) λ2.0041 and the H2 2–0 transitions (light green) S(2) λ1.1382, S(3) λ1.1175 and S(4) λ1.0998 in the J band. The solid red line shows the single-temperature fit based on the fluxes of the lines detected in the X-shooter spectrum and assuming fully thermalised LTE gas conditions. The EMIR data are shown for comparison.
Current usage metrics show cumulative count of Article Views (full-text article views including HTML views, PDF and ePub downloads, according to the available data) and Abstracts Views on Vision4Press platform.
Data correspond to usage on the plateform after 2015. The current usage metrics is available 48-96 hours after online publication and is updated daily on week days.
Initial download of the metrics may take a while.