Fig. 7.
Download original image
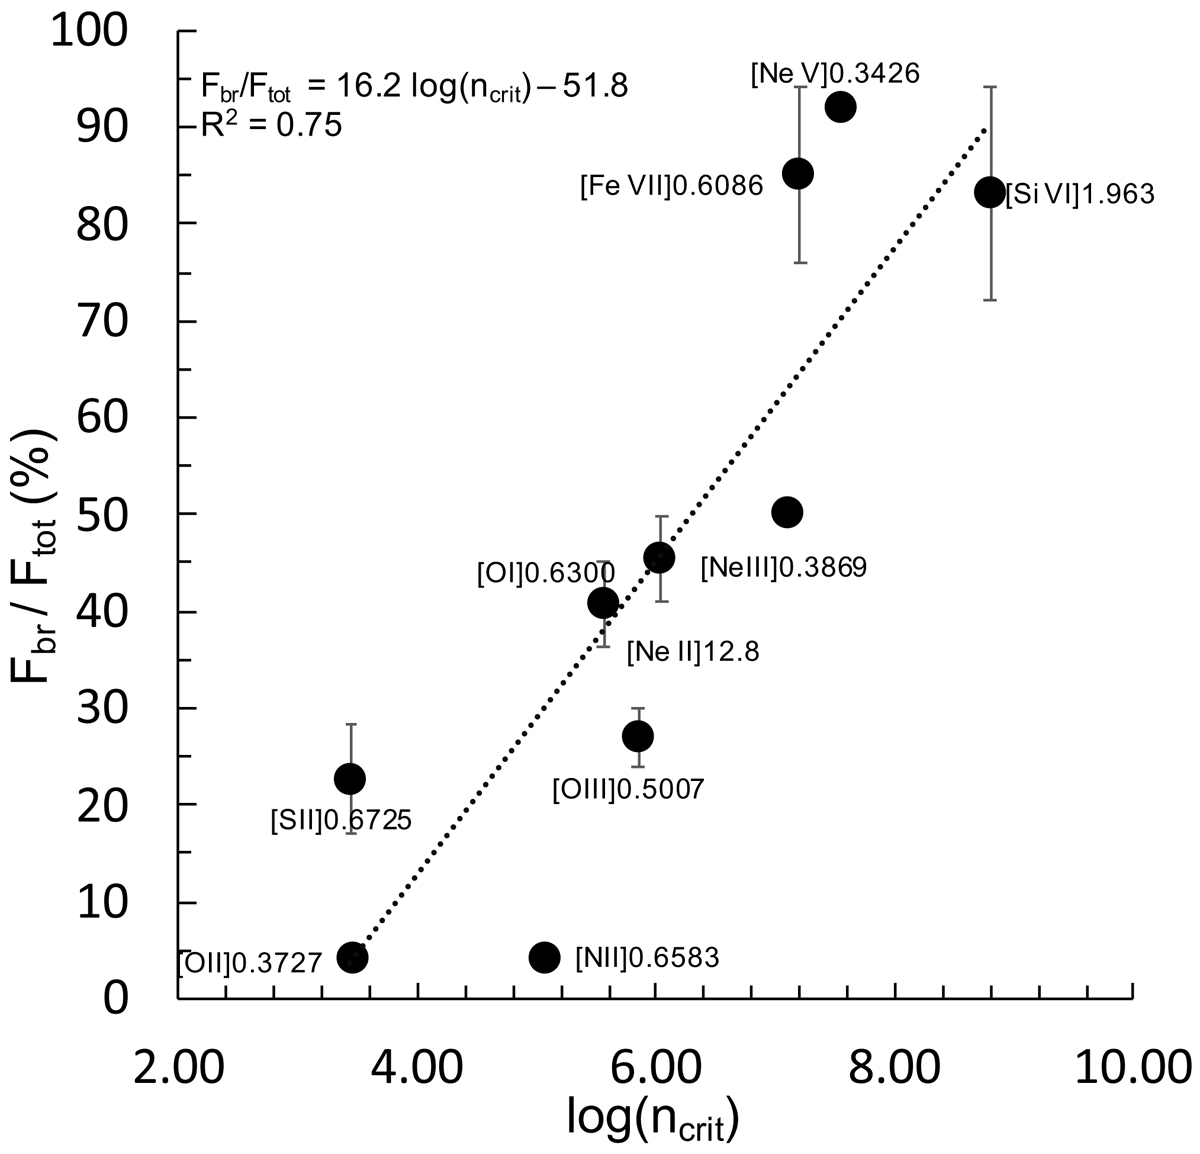
Relative contribution of the broadest component to the total line fluxes,![]() , vs. critical density, ncrit, in log and cm−3. The dotted line is the linear fit.
, vs. critical density, ncrit, in log and cm−3. The dotted line is the linear fit. ![]() values are from: this work ([SiVI] and [FeVII]); Holt et al. (2003) and Rodríguez Zaurín et al. (2013, optical lines) and (Guillard et al. 2012, [NeII]12.8 μm). Data with no error bars have no errors available.
values are from: this work ([SiVI] and [FeVII]); Holt et al. (2003) and Rodríguez Zaurín et al. (2013, optical lines) and (Guillard et al. 2012, [NeII]12.8 μm). Data with no error bars have no errors available.
Current usage metrics show cumulative count of Article Views (full-text article views including HTML views, PDF and ePub downloads, according to the available data) and Abstracts Views on Vision4Press platform.
Data correspond to usage on the plateform after 2015. The current usage metrics is available 48-96 hours after online publication and is updated daily on week days.
Initial download of the metrics may take a while.