Fig. 5.
Download original image
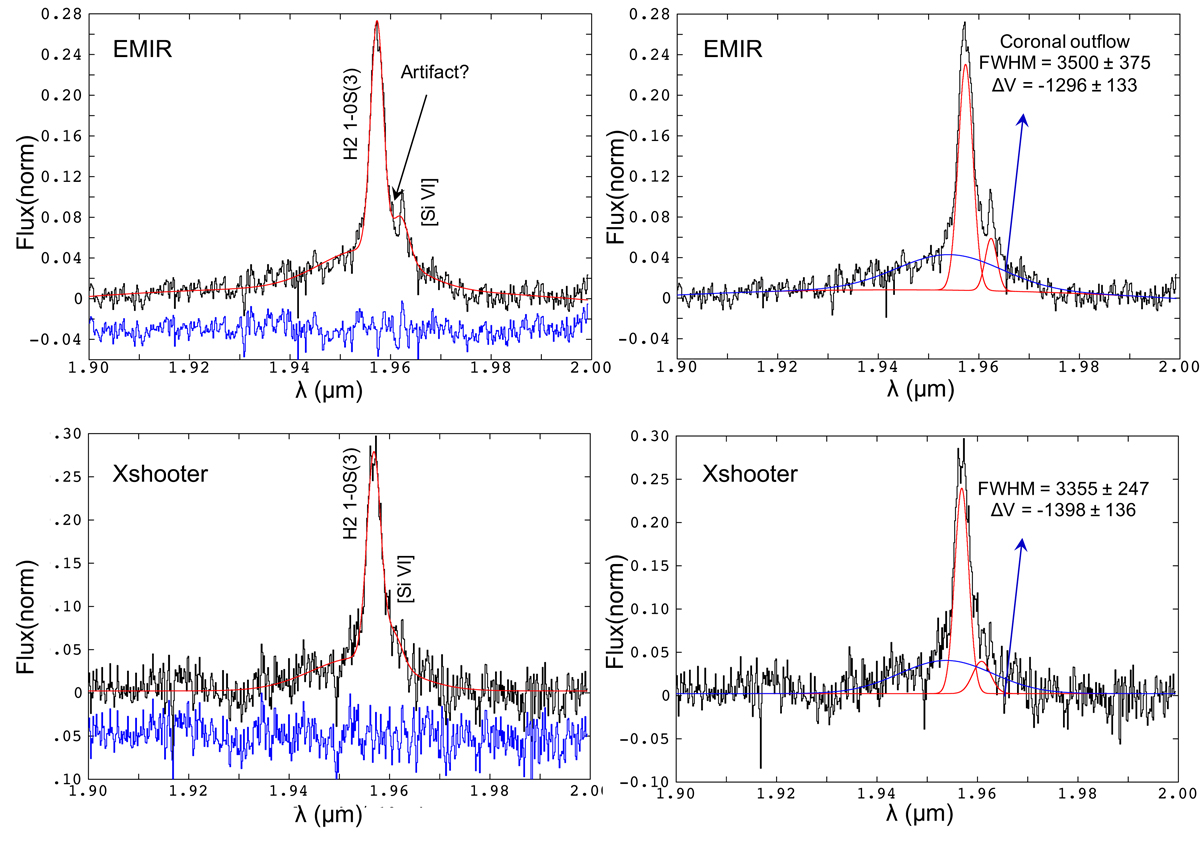
Fit of the H2 (1–0) S(3) and [SiVI] blend based on the EMIR (top) and the X-shooter (bottom) spectra, after subtracting the continuum and the contribution of Brδ. The data, fit and residuals are shown on the left panels. The individual components of the fit are shown on the right panels. Colour code as in Fig. 3. The FWHM and ΔV relative to zsys correspond to the broadest component (blue), which is responsible for the broad pedestal.
Current usage metrics show cumulative count of Article Views (full-text article views including HTML views, PDF and ePub downloads, according to the available data) and Abstracts Views on Vision4Press platform.
Data correspond to usage on the plateform after 2015. The current usage metrics is available 48-96 hours after online publication and is updated daily on week days.
Initial download of the metrics may take a while.