Fig. 4.
Download original image
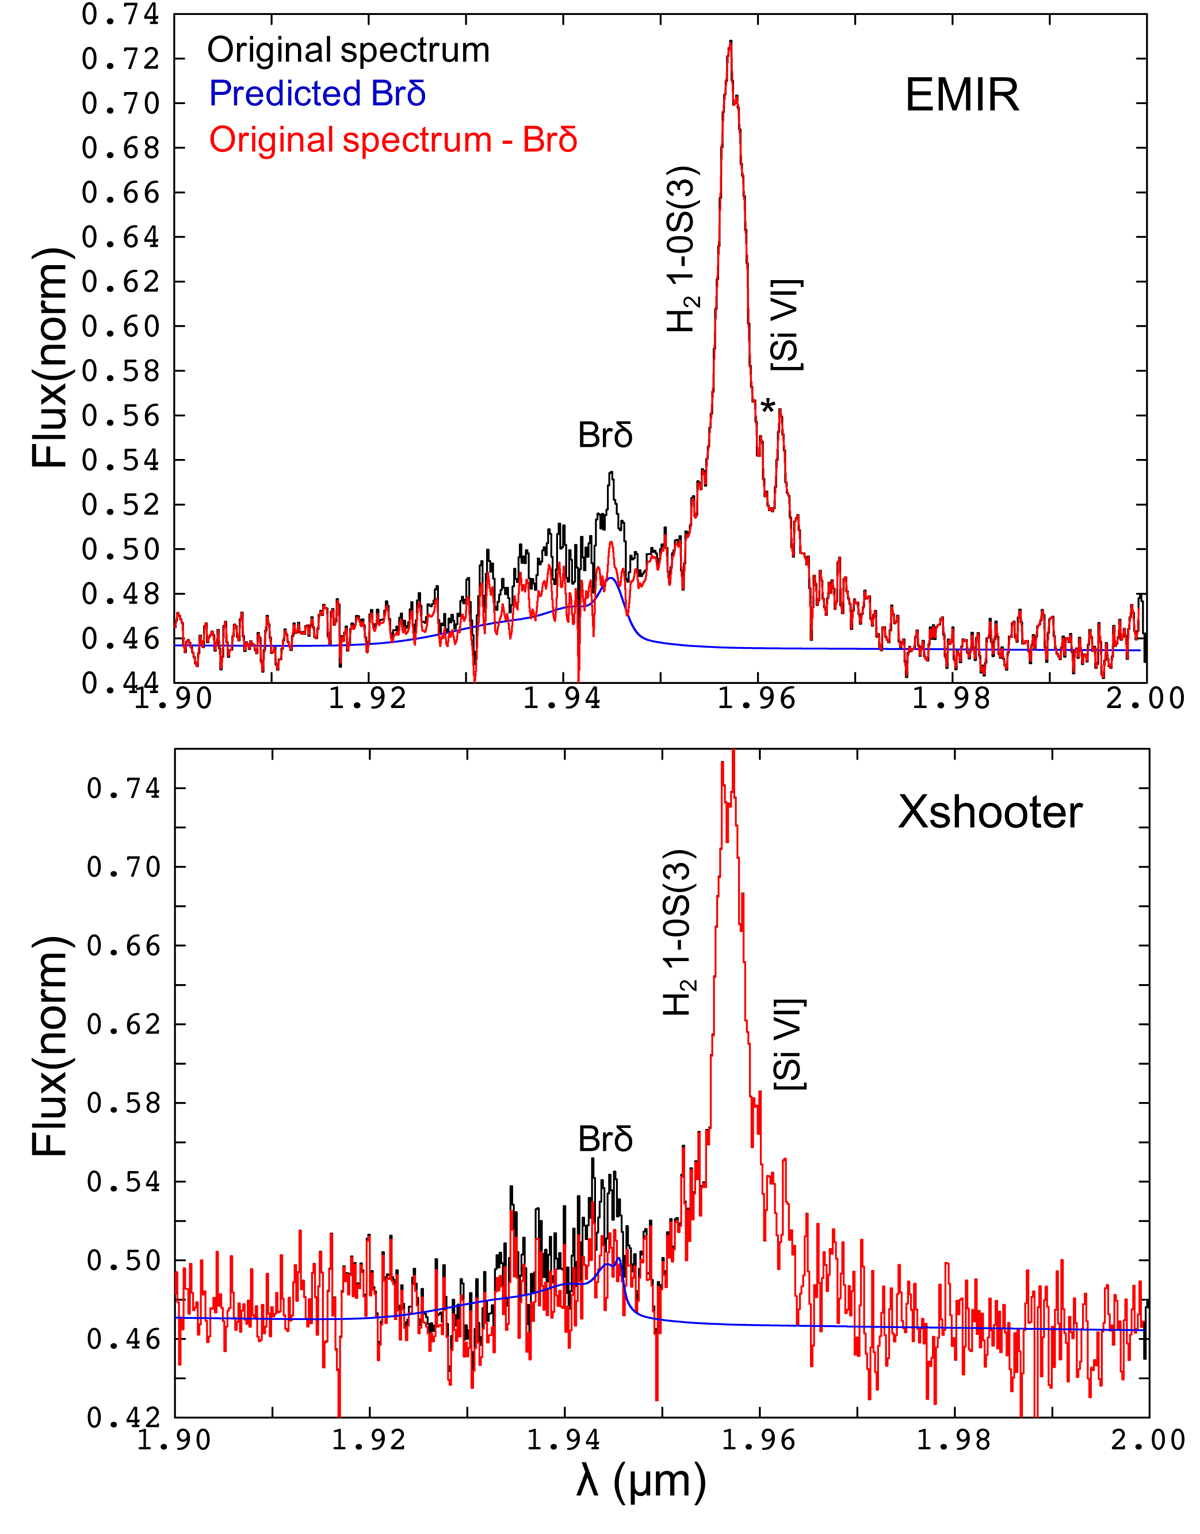
Brδ, H2 (1–0) S(3) and [SiVI] blend (black) in the EMIR (top) and X-shooter (bottom) rest frame spectra. The blue line shows the predicted Brδ profile (+ continuum; see text). The results of subtracting Brδ from the original spectra are shown in red. The * marks the location of (or near) a possible artefact in the EMIR spectrum, responsible for the unexpectedly narrow [SiVI] peak.
Current usage metrics show cumulative count of Article Views (full-text article views including HTML views, PDF and ePub downloads, according to the available data) and Abstracts Views on Vision4Press platform.
Data correspond to usage on the plateform after 2015. The current usage metrics is available 48-96 hours after online publication and is updated daily on week days.
Initial download of the metrics may take a while.