Fig. 3.
Download original image
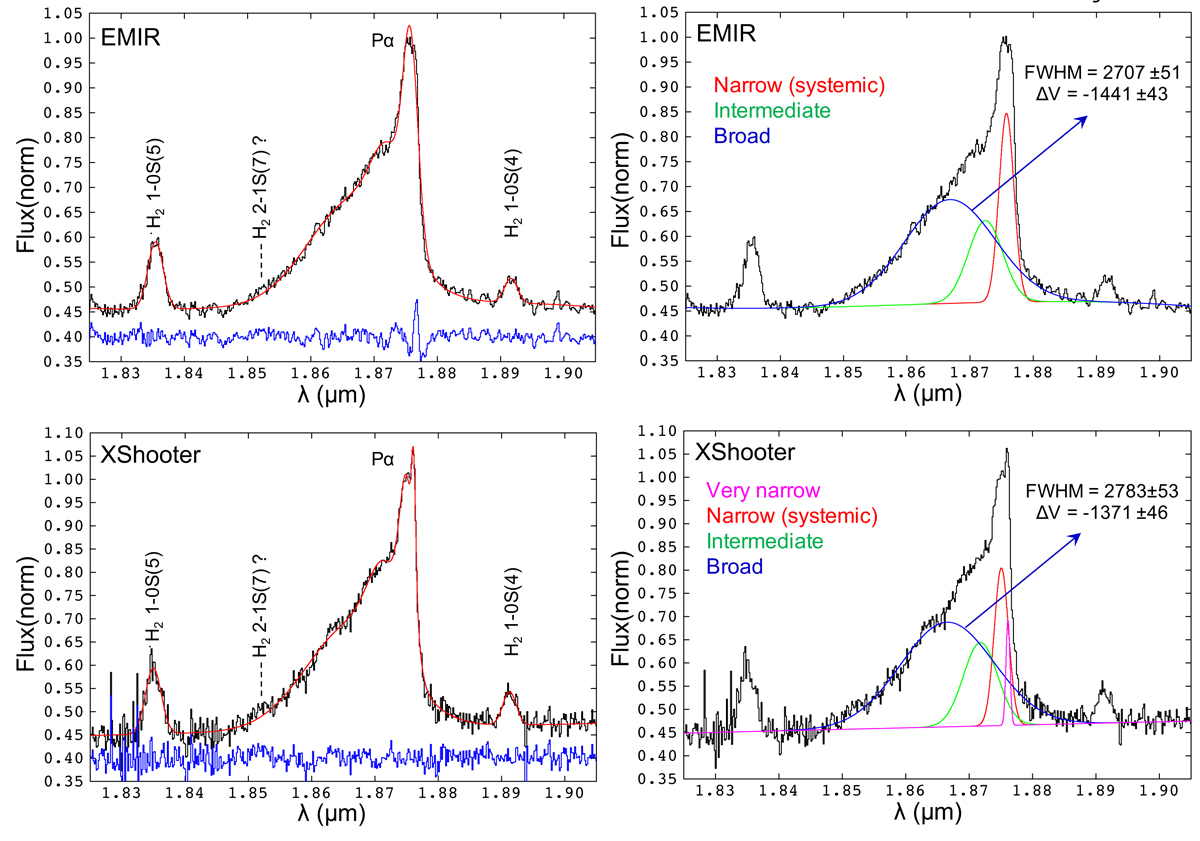
Fit of Paα using the 0.8″ × 1.4″ EMIR (top) and 1.2″ × 4.0″ X-shooter (bottom) rest frame spectra. Left panels: data (black), fit (red) and residuals (blue), shifted on the vertical axis for visualisation. The small excess of flux on the blue wing of Paα may be H2 2-1S(7) λ1.8523. Right: Individual components of the fit of Paα, where the values of FWHM and ΔV in km s−1 (velocity shift relative to the narrow or systemic component, in red) refer to the broadest (blue) kinematic component. It is due to a prominent ionised outflow. The spectra in these and all other figures have been normalised by the peak flux of Paα.
Current usage metrics show cumulative count of Article Views (full-text article views including HTML views, PDF and ePub downloads, according to the available data) and Abstracts Views on Vision4Press platform.
Data correspond to usage on the plateform after 2015. The current usage metrics is available 48-96 hours after online publication and is updated daily on week days.
Initial download of the metrics may take a while.