Fig. 13.
Download original image
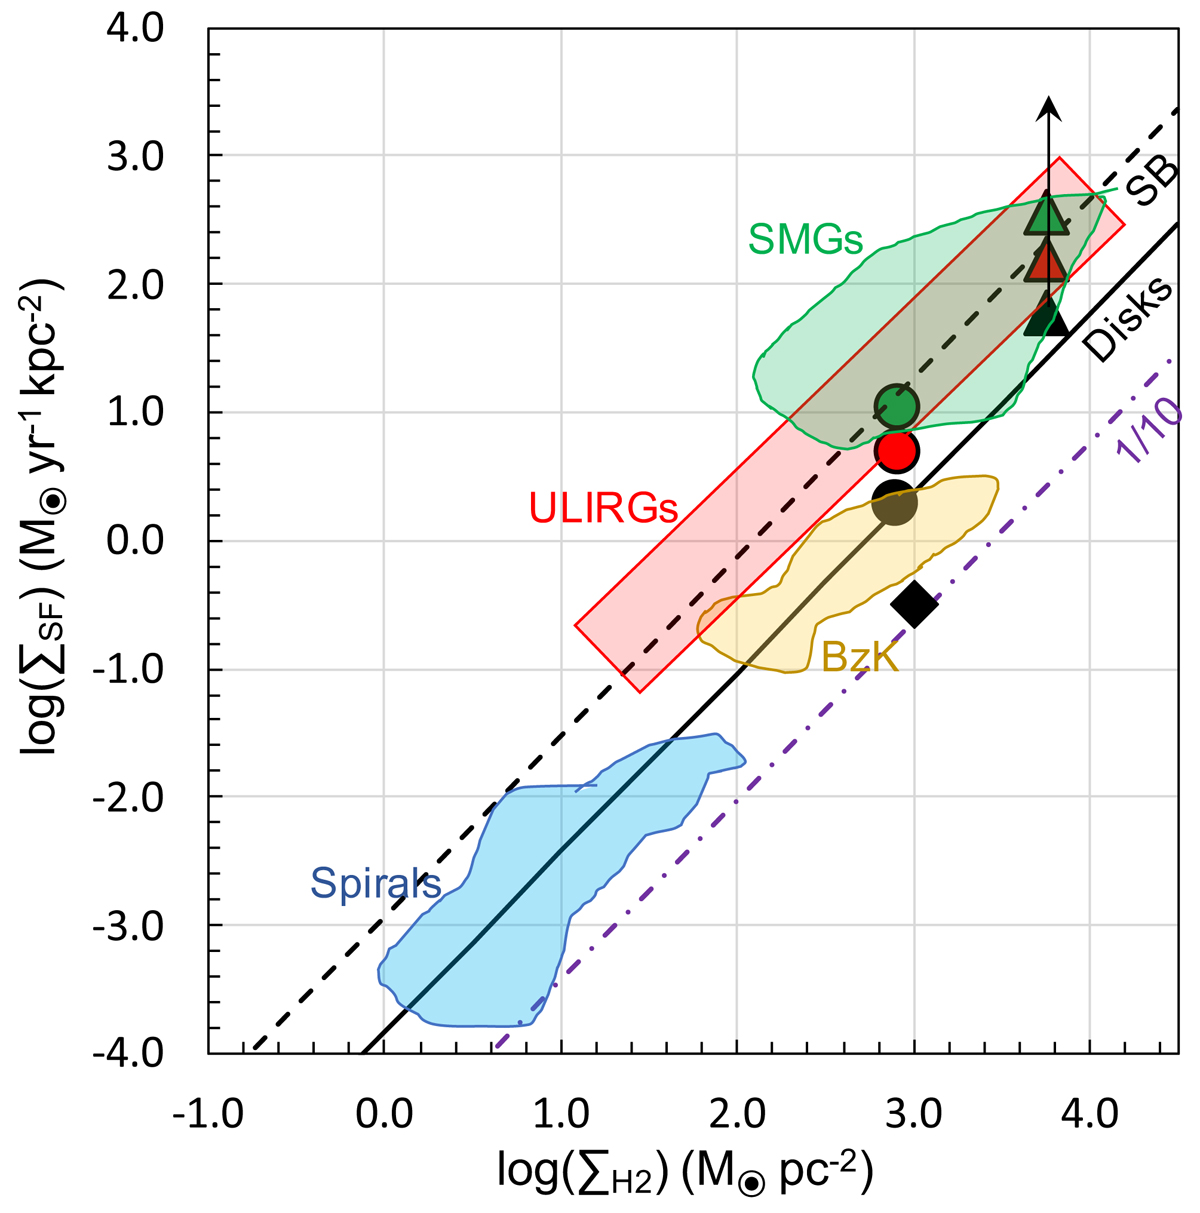
Surface density of star formation compared to gas (cold molecular + neutral) density gas (K–S diagrams; Kennicutt 1998). This figure has been adapted from Fig. 2 in Daddi et al. (2010a). The coloured areas roughly enclose different galaxy types indicated with labels. The black solid line (‘disks sequence’) is a fit to local spirals and z ∼ 1.5 BzK selected galaxies (slope of 1.42). The upper dashed line is the same relation shifted up by 0.9 dex to fit local U/LIRGs and SMGs. The dot-dashed purple line corresponds to a star formation suppression of a factor of 10 relative to the disks sequence. The coloured symbols are different locations of 4C12.50 for the diversity of parameters used in our calculations. The triangles correspond to cases A and the circles correspond to cases B in Table 5. The black diamond comes from Lanz et al. 2016 (case C). The triangles represent the values obtained from recent high angular resolution ALMA CO(2–1) data.
Current usage metrics show cumulative count of Article Views (full-text article views including HTML views, PDF and ePub downloads, according to the available data) and Abstracts Views on Vision4Press platform.
Data correspond to usage on the plateform after 2015. The current usage metrics is available 48-96 hours after online publication and is updated daily on week days.
Initial download of the metrics may take a while.