Open Access
Fig. 12.
Download original image
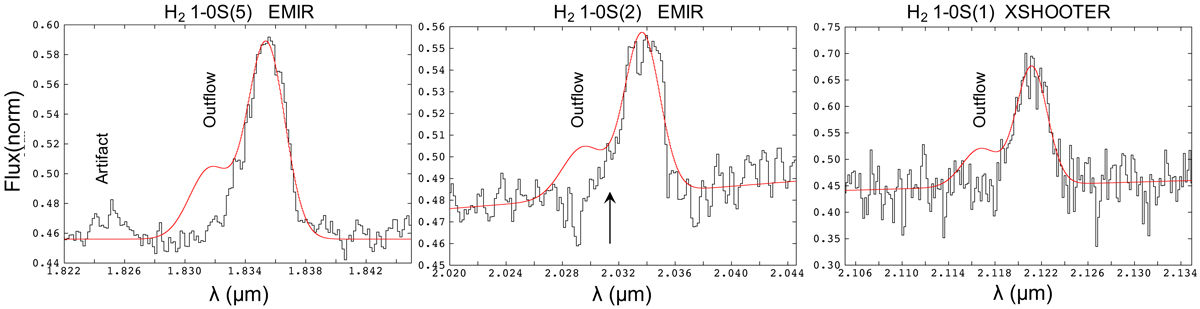
Observed emission (black) of H2 S(5) (left), S(2) (middle) and S(1) (right) and the expected profiles (red), for which we assume the presence of a molecular outflow with similar kinematic properties and relative flux contribution as in the MIR H2 lines. The troughs at the peak of the S(2) and S(1) are due to the noise.
Current usage metrics show cumulative count of Article Views (full-text article views including HTML views, PDF and ePub downloads, according to the available data) and Abstracts Views on Vision4Press platform.
Data correspond to usage on the plateform after 2015. The current usage metrics is available 48-96 hours after online publication and is updated daily on week days.
Initial download of the metrics may take a while.