Fig. 10.
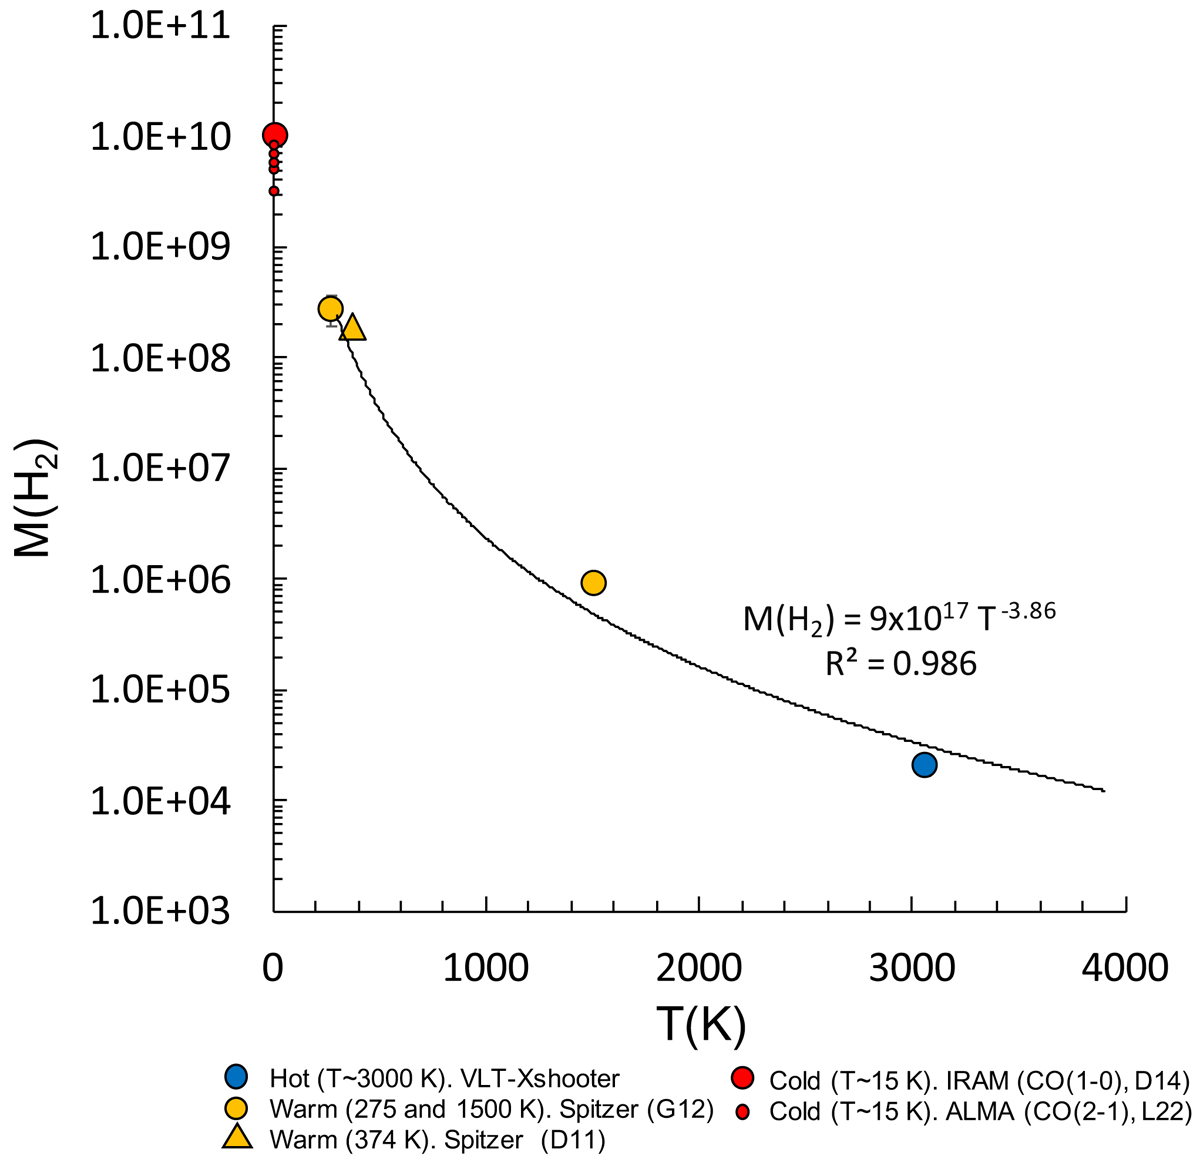
Download original image
Dependence of the molecular gas mass in M⊙ with excitation temperature for 4C12.50. The colour code clarifies the tempertature ranges considered as ‘cold’, ‘warm’ and ‘hot’ in this work. The small red circles indicate the cold H2 masses infered from CO(2–1) ALMA data for different apertures with the radius varying from 0.5″ to 2″ (see text). The black solid line shows the best fit to the warm (G12) and hot data points, with the equation and coefficient of determination, R2. G12: Guillard et al. (2012); D11: Dasyra & Combes (2011); D14: Dasyra et al. (2014); L22: Lamperti et al. (2022).
Current usage metrics show cumulative count of Article Views (full-text article views including HTML views, PDF and ePub downloads, according to the available data) and Abstracts Views on Vision4Press platform.
Data correspond to usage on the plateform after 2015. The current usage metrics is available 48-96 hours after online publication and is updated daily on week days.
Initial download of the metrics may take a while.