Fig. 7.
Download original image
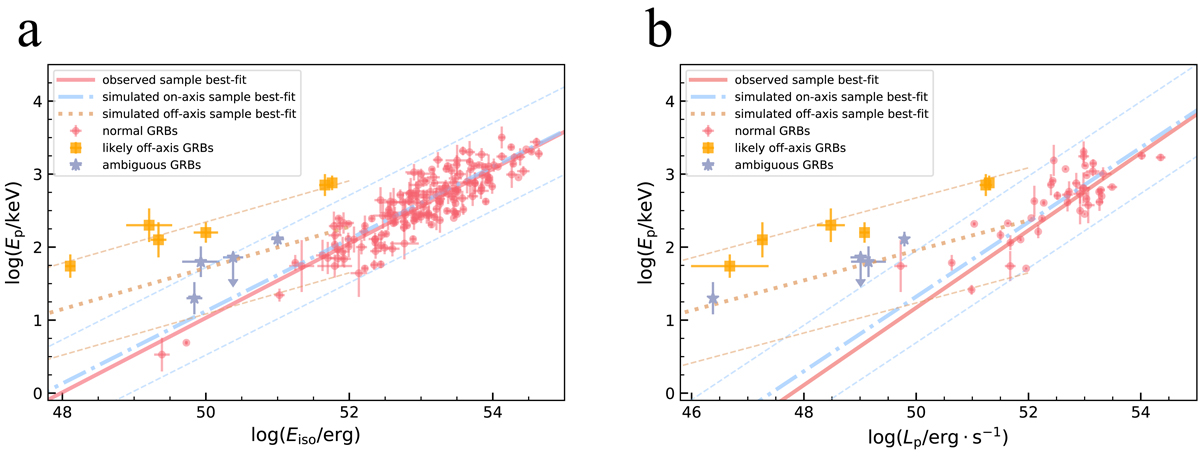
Distribution of all the observed GRBs. Panel a: Ep vs. Eiso. Panel b: Ep vs. Lp. The dash-dotted lines represent our theoretical results for on-axis bursts, and the thick dotted line shows our theoretical results for off-axis bursts. The 3σ confidence levels are marked correspondingly. The solid lines are the best-fit results for normal GRBs.
Current usage metrics show cumulative count of Article Views (full-text article views including HTML views, PDF and ePub downloads, according to the available data) and Abstracts Views on Vision4Press platform.
Data correspond to usage on the plateform after 2015. The current usage metrics is available 48-96 hours after online publication and is updated daily on week days.
Initial download of the metrics may take a while.