Fig. 5.
Download original image
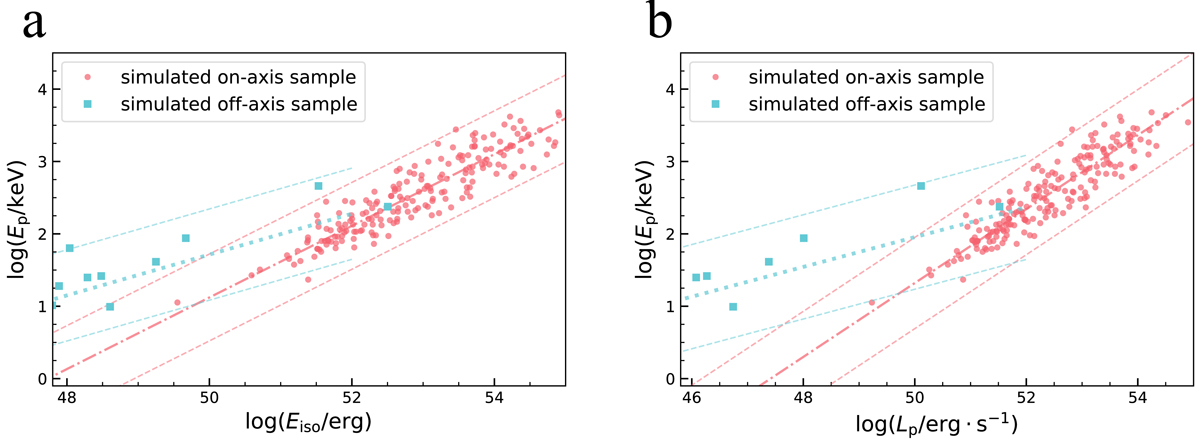
Distribution of simulated off-axis bursts as compared with that of on-axis ones. a) All mock bursts on the Ep − Eiso plane. b) All mock bursts on the Ep − Lp plane. The dash-dotted line and the dotted line correspond to the best-fit result for on- and off-axis samples, respectively. The dashed lines represent the corresponding 3σ confidence level. Most of the off-axis bursts are too weak to appear in the two panels here.
Current usage metrics show cumulative count of Article Views (full-text article views including HTML views, PDF and ePub downloads, according to the available data) and Abstracts Views on Vision4Press platform.
Data correspond to usage on the plateform after 2015. The current usage metrics is available 48-96 hours after online publication and is updated daily on week days.
Initial download of the metrics may take a while.