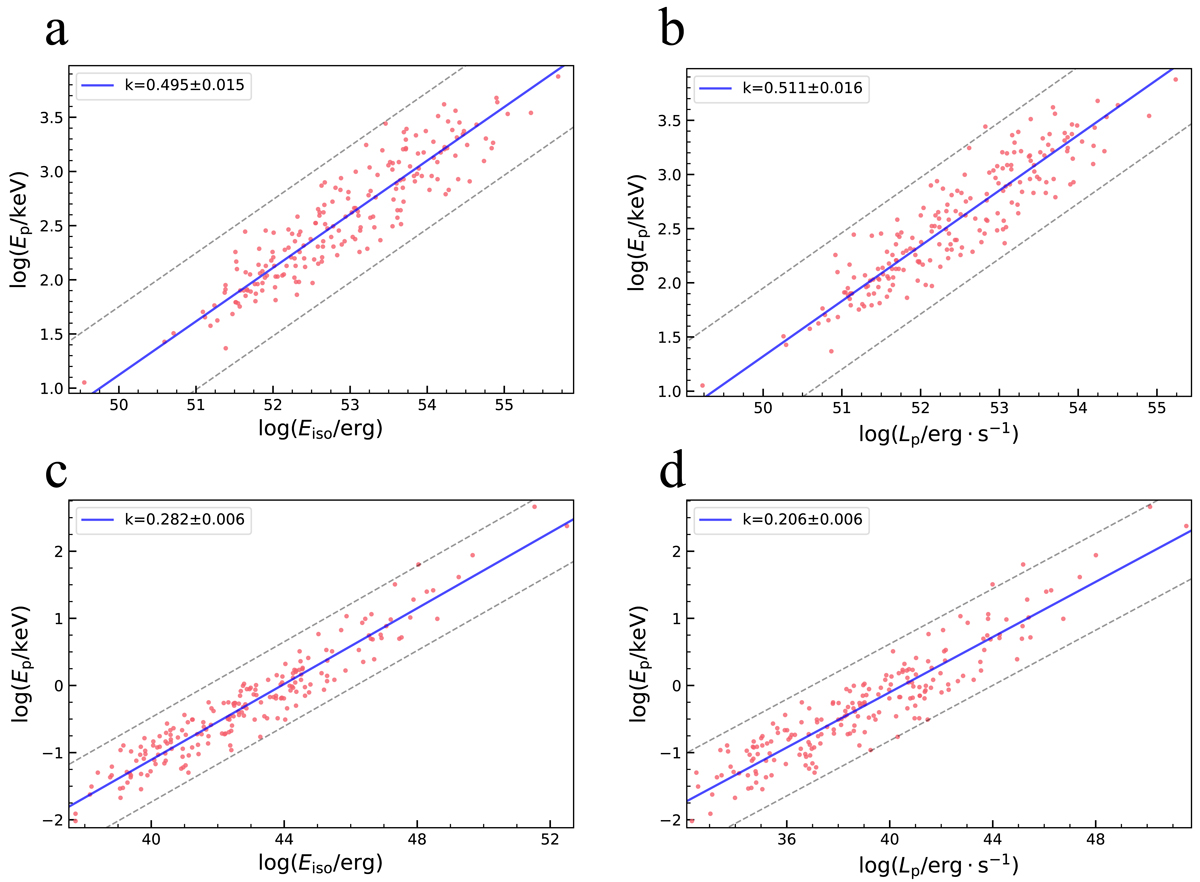
Fig. 4.
Download original image
Monte Carlo simulation results. (a,b) Distribution of simulated bursts on the Ep − Eiso plane and the Ep − Lp plane for the on-axis cases. (c,d) Distribution of simulated bursts on the Ep − Eiso plane and the Ep − Lp plane for off-axis cases. The solid lines show the best-fitting results for the simulated data points, and the dashed lines represent the 3σ confidence level. To conclude, for on-axis bursts, the best-fit Amati relation is ![]() and the best-fit Yonetoku relation is
and the best-fit Yonetoku relation is ![]() . For off-axis bursts, the best-fit Amati relation is
. For off-axis bursts, the best-fit Amati relation is ![]() , while the best-fit Yonetoku relation is
, while the best-fit Yonetoku relation is ![]() .
.
Current usage metrics show cumulative count of Article Views (full-text article views including HTML views, PDF and ePub downloads, according to the available data) and Abstracts Views on Vision4Press platform.
Data correspond to usage on the plateform after 2015. The current usage metrics is available 48-96 hours after online publication and is updated daily on week days.
Initial download of the metrics may take a while.