Open Access
Fig. 2.
Download original image
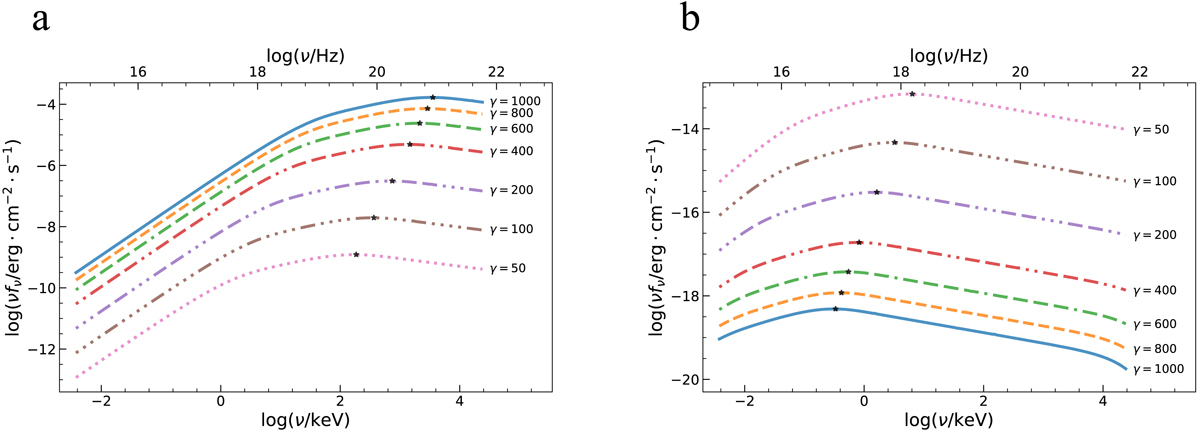
Time-integrated spectrum for different γ values (marked in the figure). Panel a: Spectrum of on-axis cases. Panel b: Spectrum of off-axis cases. The black star on each curve marks the position of the peak energy (Ep).
Current usage metrics show cumulative count of Article Views (full-text article views including HTML views, PDF and ePub downloads, according to the available data) and Abstracts Views on Vision4Press platform.
Data correspond to usage on the plateform after 2015. The current usage metrics is available 48-96 hours after online publication and is updated daily on week days.
Initial download of the metrics may take a while.