Fig. 7.
Download original image
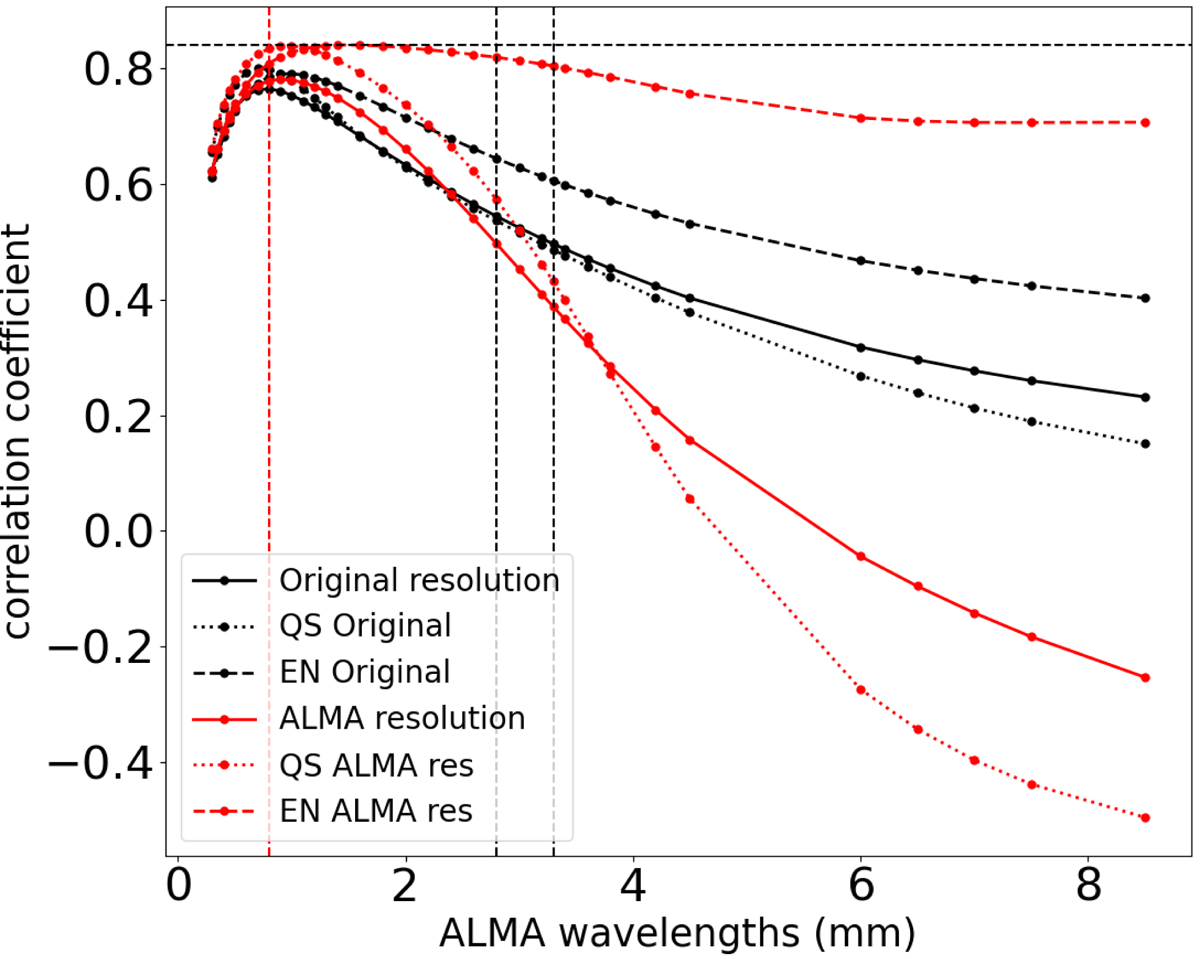
Comparison of the calculated Pearson correlation coefficients with two different resolutions. Black vertical lines show the ALMA band 3 range and black horizontal lines show the Molnar et. al. correlation coefficient = 0.84. and the red vertical line shows the maximum correlation in the original resolution case, which is at 0.8 mm.
Current usage metrics show cumulative count of Article Views (full-text article views including HTML views, PDF and ePub downloads, according to the available data) and Abstracts Views on Vision4Press platform.
Data correspond to usage on the plateform after 2015. The current usage metrics is available 48-96 hours after online publication and is updated daily on week days.
Initial download of the metrics may take a while.