Fig. 6.
Download original image
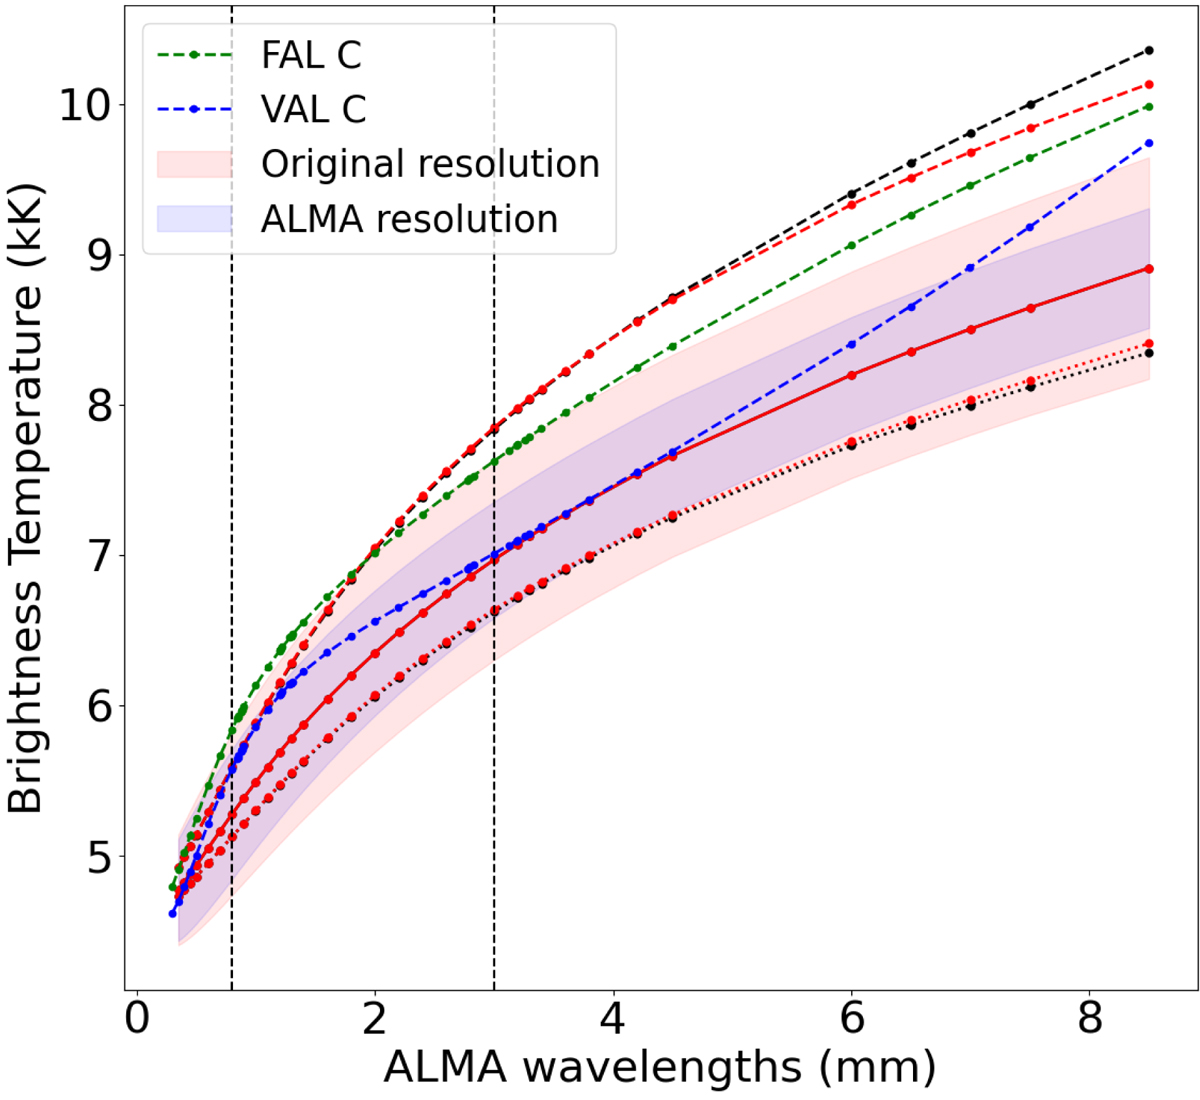
Comparison of the mean brightness temperatures for mm wavelengths at the resolution of the original simulations (in black) and the resolution of the observations from the ALMA observatory (in red). In both these cases, the whole simulation box (solid lines), the QS box (dotted lines), and the EN box (dashed lines) are taken separately. The pink and blue shaded regions show a region of one standard deviation around the mean for the original resolution and the degraded resolution case, respectively. The green and blue dashed lines show brightness temperature trends for FAL C and VAL C models, respectively. The black dashed vertical lines mark 0.8 mm and 3 mm.
Current usage metrics show cumulative count of Article Views (full-text article views including HTML views, PDF and ePub downloads, according to the available data) and Abstracts Views on Vision4Press platform.
Data correspond to usage on the plateform after 2015. The current usage metrics is available 48-96 hours after online publication and is updated daily on week days.
Initial download of the metrics may take a while.