Fig. 5.
Download original image
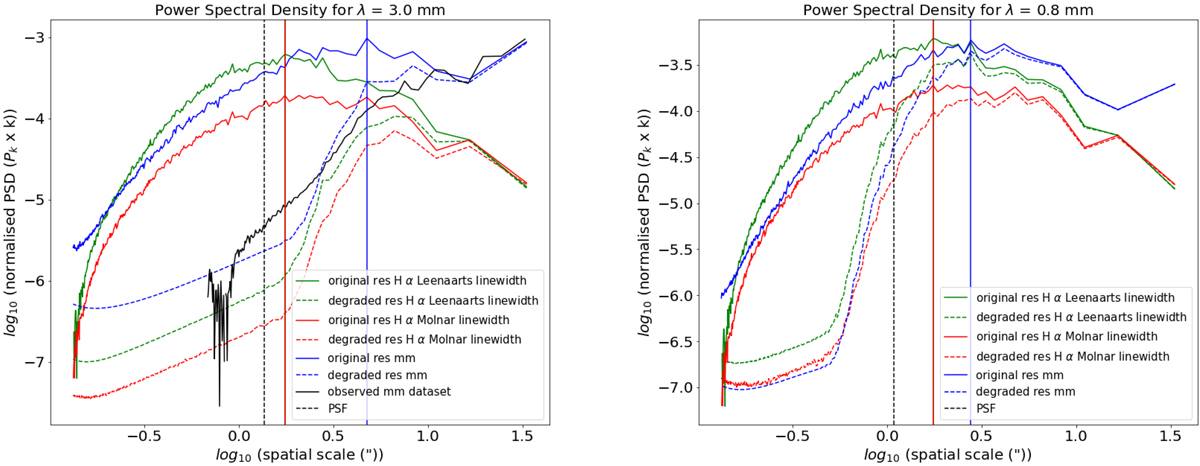
Normalised power spectral density kPk plots for time-averaged datasets of mm brightness temperatures with both definitions of linewidth at 3.0 mm and 0.8 mm. The solid lines represent the original-resolution data and the dashed lines show the spatially degraded data, green for the Leenaarts et al. (2012) linewidth, red for the Molnar et al. (2019) definition of linewidth, and blue for the corresponding mm wavelength. The vertical lines represent the dominant spatial scales (in arcsec) for the original-resolution data with the (Leenaarts et al. 2012) definition of linewidth and the Molnar et al. (2019) definition of linewidth. The black dashed line represents the PSF corresponding to the mm wavelength, showing the resolution limit for the degraded dataset. In the left panel, the spatial power spectral density for the Band 3 ALMA observations (ADS/NRAO.ALMA#2016.1.01129.S) as used by Molnar et al. (2019) and shown in Fig. 11 are plotted as the black solid line. The power spectral density was calculated for all time steps in the time range considered by Molnar et al. (2019) and then averaged in time.
Current usage metrics show cumulative count of Article Views (full-text article views including HTML views, PDF and ePub downloads, according to the available data) and Abstracts Views on Vision4Press platform.
Data correspond to usage on the plateform after 2015. The current usage metrics is available 48-96 hours after online publication and is updated daily on week days.
Initial download of the metrics may take a while.