Fig. 3.
Download original image
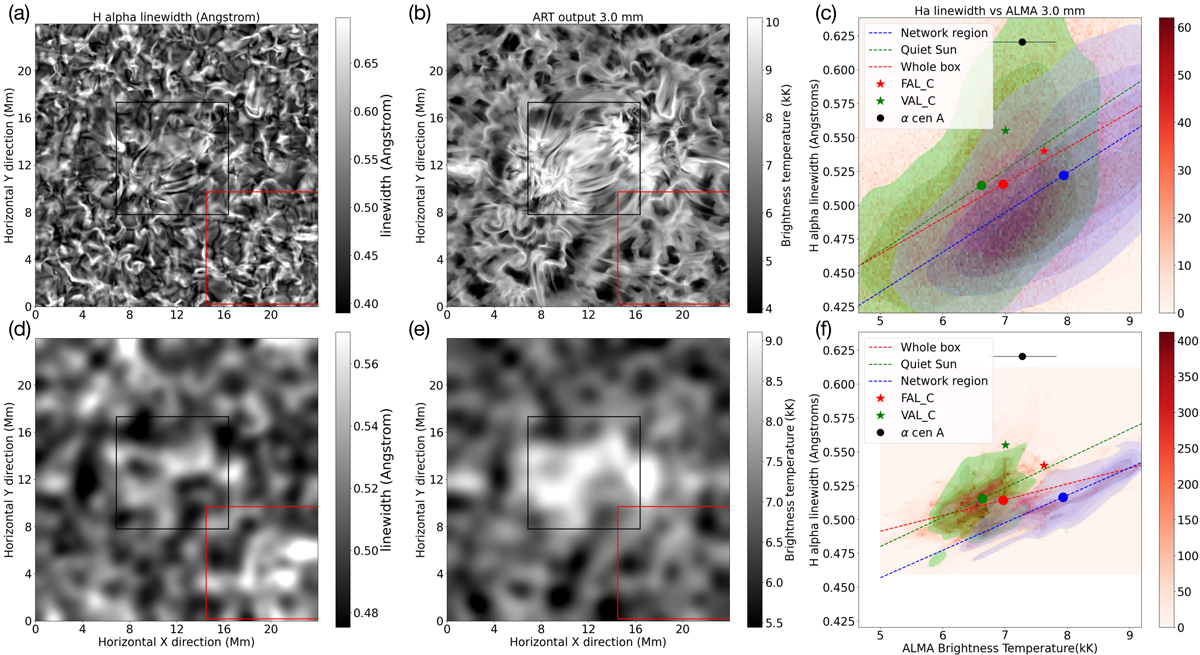
Comparisons of the Hα line core width (a,d) and ALMA at 3.0 mm brightness temperature maps (b,e) at original (top row) and degraded (bottom row) resolution. The black and red boxes on these maps denote the chosen EN and QS regions, respectively. The last column is a correlation contour plot between the Hα linewidth and ALMA brightness temperature at 3.0 mm, with contours with linear fits (dashed lines) and means (circles) of the three cases: the whole simulation box in red, the QS box in green, and the EN region box in blue. The red and green star data points are for the FAL C and VAL C 1D semi-empirical models and the black circle with error bars is an observational data point for the G2V type star α Cen A with a linewidth of 0.62 Å.
Current usage metrics show cumulative count of Article Views (full-text article views including HTML views, PDF and ePub downloads, according to the available data) and Abstracts Views on Vision4Press platform.
Data correspond to usage on the plateform after 2015. The current usage metrics is available 48-96 hours after online publication and is updated daily on week days.
Initial download of the metrics may take a while.