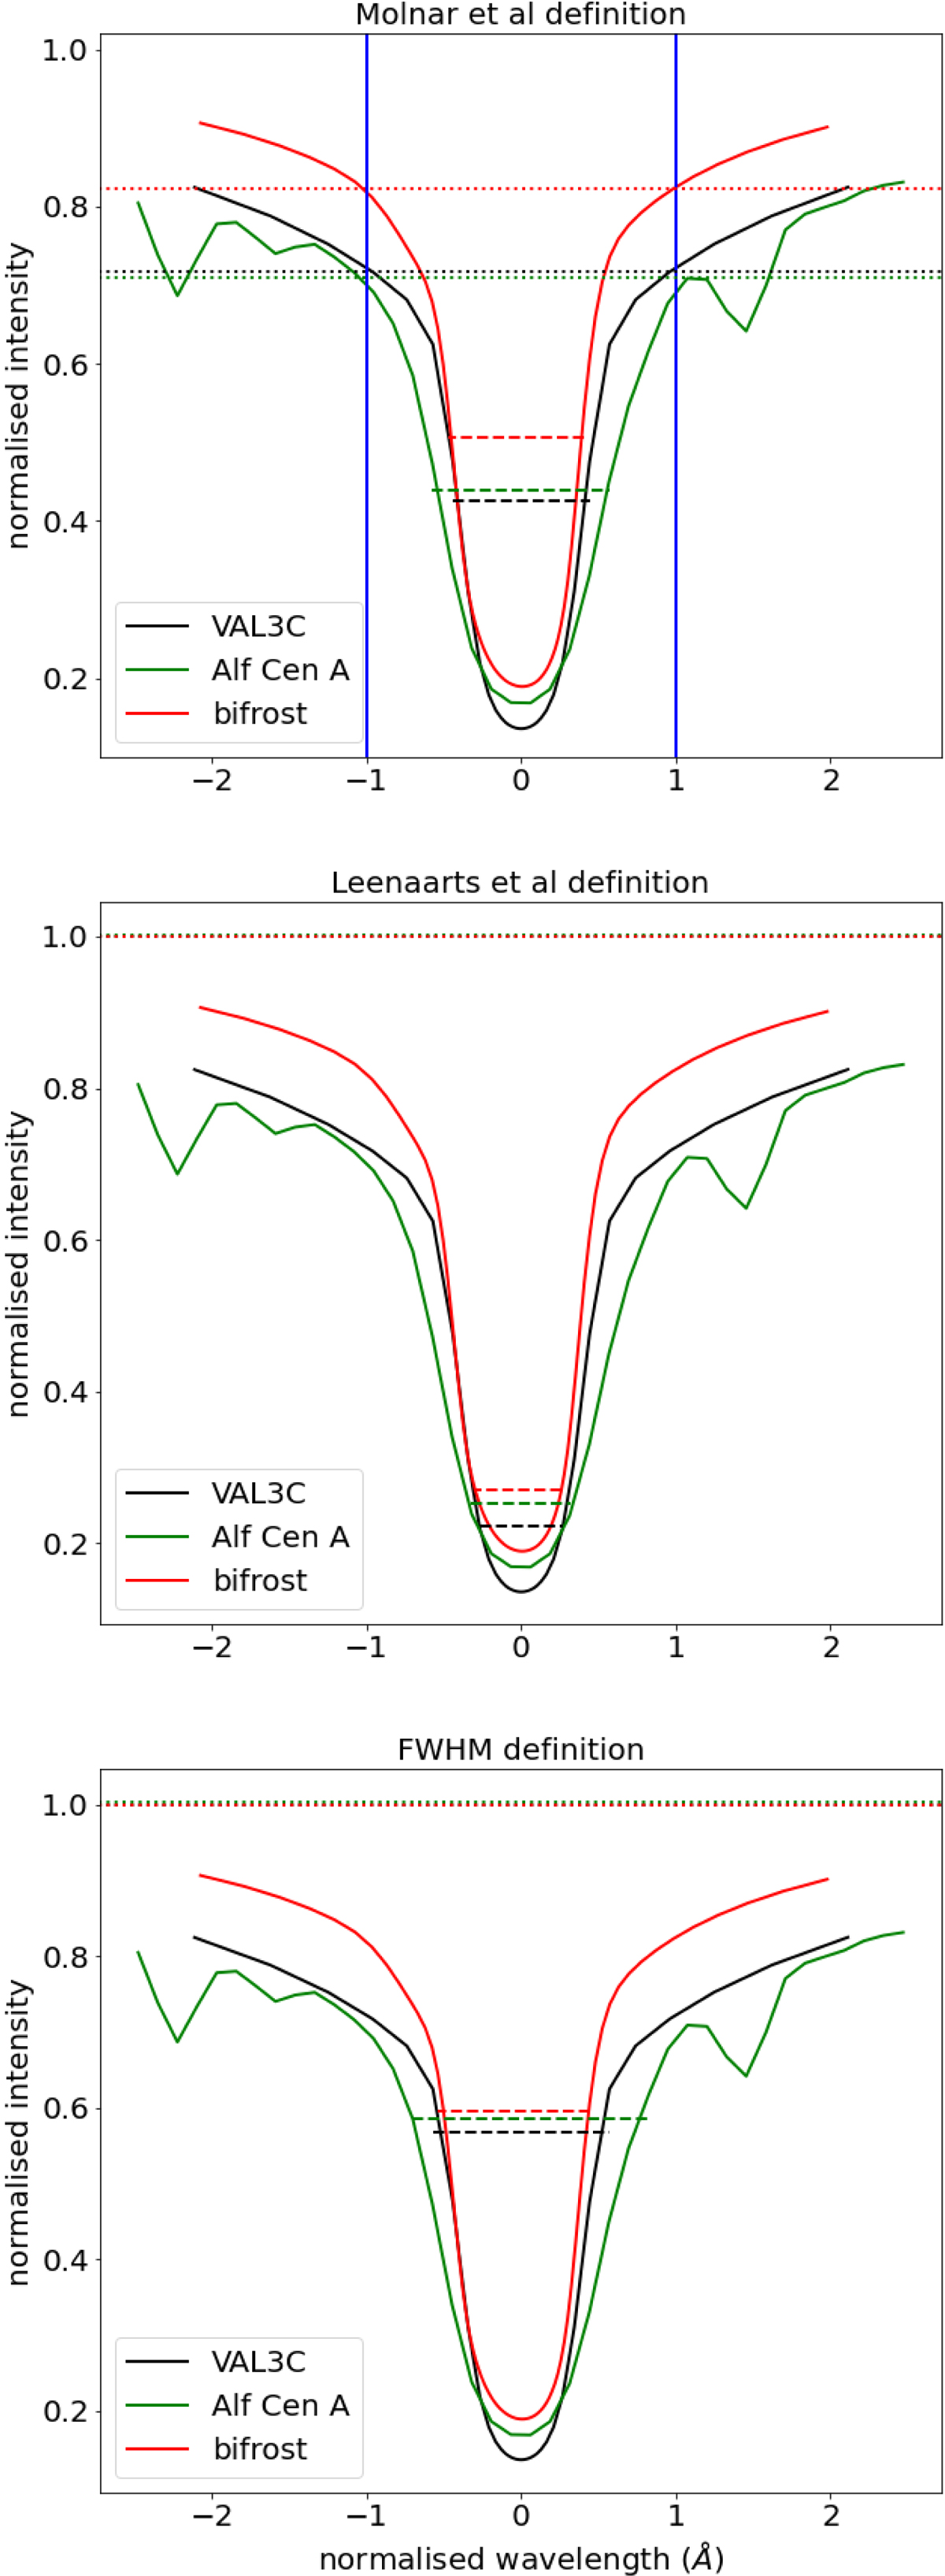
Fig. 2.
Download original image
Comparison of the linewidth as defined by Molnar et al. (2019; upper panel), by Leenaarts et al. (2012; middle panel) and as defined as the FWHM (lower panel). The red, black and green lines show normalised spectra for the VAL C model, Bifrost QS and the observed spectrum for α Cen A (Porto de Mello et al. 2008), respectively. The solid blue lines in the top panel mark ± 1 Å, while the dotted lines show the considered maxima and the dashed lines show the calculated linewidths in all three cases.
Current usage metrics show cumulative count of Article Views (full-text article views including HTML views, PDF and ePub downloads, according to the available data) and Abstracts Views on Vision4Press platform.
Data correspond to usage on the plateform after 2015. The current usage metrics is available 48-96 hours after online publication and is updated daily on week days.
Initial download of the metrics may take a while.