Fig. 18.
Download original image
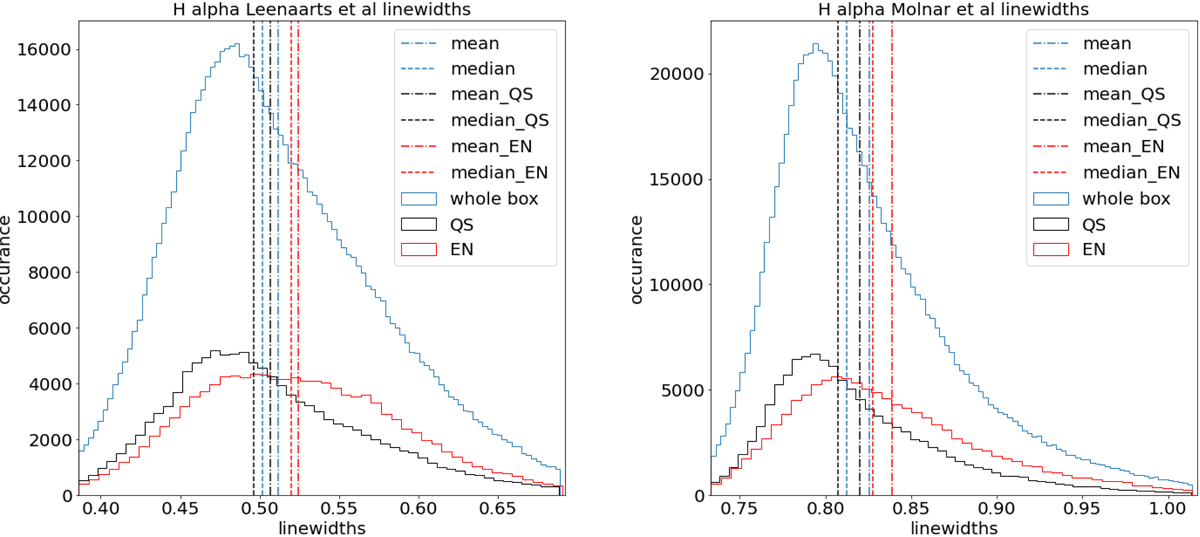
Left: Distribution of Hα line core widths (following the definition by Leenaarts et al. 2012) for the whole time series. Right: Corresponding line widths according to the definition by Molnar et al. (2019). The whole box, QS and EN regions are separately plotted in blue, black and red, and mean and median values for the three sets of pixels are indicated with a dot-dashed and dashed lines in the respective colours. Please note the difference in ranges for linewidths axes in the two plots.
Current usage metrics show cumulative count of Article Views (full-text article views including HTML views, PDF and ePub downloads, according to the available data) and Abstracts Views on Vision4Press platform.
Data correspond to usage on the plateform after 2015. The current usage metrics is available 48-96 hours after online publication and is updated daily on week days.
Initial download of the metrics may take a while.