Fig. 16.
Download original image
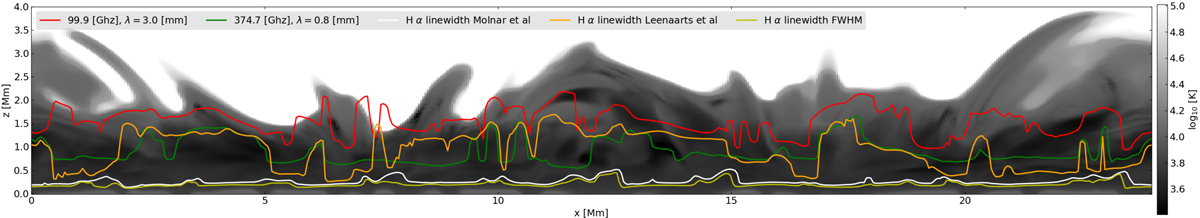
Simulated logarithmic gas temperature (grey-scale) in a vertical slice of 3D rMHD Bifrost simulations. The solid lines represent the heights at which the optical depth is unity at a wavelength of 3.2 mm (red), and 0.8 mm (green), which correspond to ALMA bands 3, 5 and 7, respectively. The orange, white and yellow lines show the average heights at which the red and blue sides of the Hα line width according to the Leenaarts et al. (2012), Molnar et al. (2019) and FWHM definitions of linewidth are formed.
Current usage metrics show cumulative count of Article Views (full-text article views including HTML views, PDF and ePub downloads, according to the available data) and Abstracts Views on Vision4Press platform.
Data correspond to usage on the plateform after 2015. The current usage metrics is available 48-96 hours after online publication and is updated daily on week days.
Initial download of the metrics may take a while.