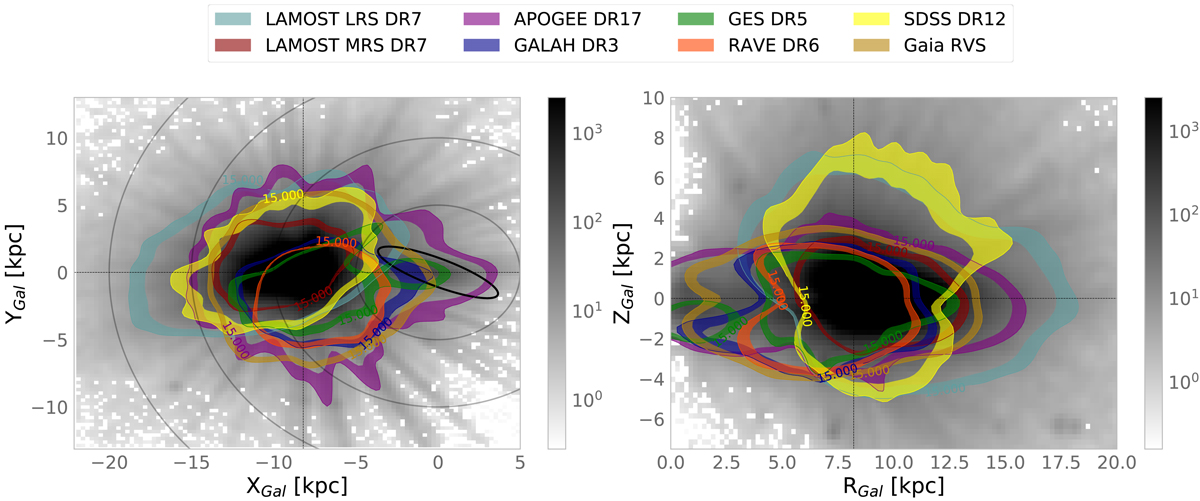
Fig. 3.
Download original image
Galactic distribution of all spectroscopic surveys for which we present StarHorse results in this paper. The grey background density shows the star counts for all surveys combined, while the coloured bands trace the region between iso-contours of 25 000 and 15 000 stars per pixel for each survey. To guide the eye, grey circles are placed in multiples of 5 kpc around the Galactic centre in the left panel. The approximate location and extent of the Galactic bar is indicated by the black ellipse (minor axis = 2 kpc; major axis = 8 kpc; inclination = 25°), and the solar position is marked by the dashed lines. Left panel: cartesian XY projection. Right panel: cylindrical RZ projection.
Current usage metrics show cumulative count of Article Views (full-text article views including HTML views, PDF and ePub downloads, according to the available data) and Abstracts Views on Vision4Press platform.
Data correspond to usage on the plateform after 2015. The current usage metrics is available 48-96 hours after online publication and is updated daily on week days.
Initial download of the metrics may take a while.