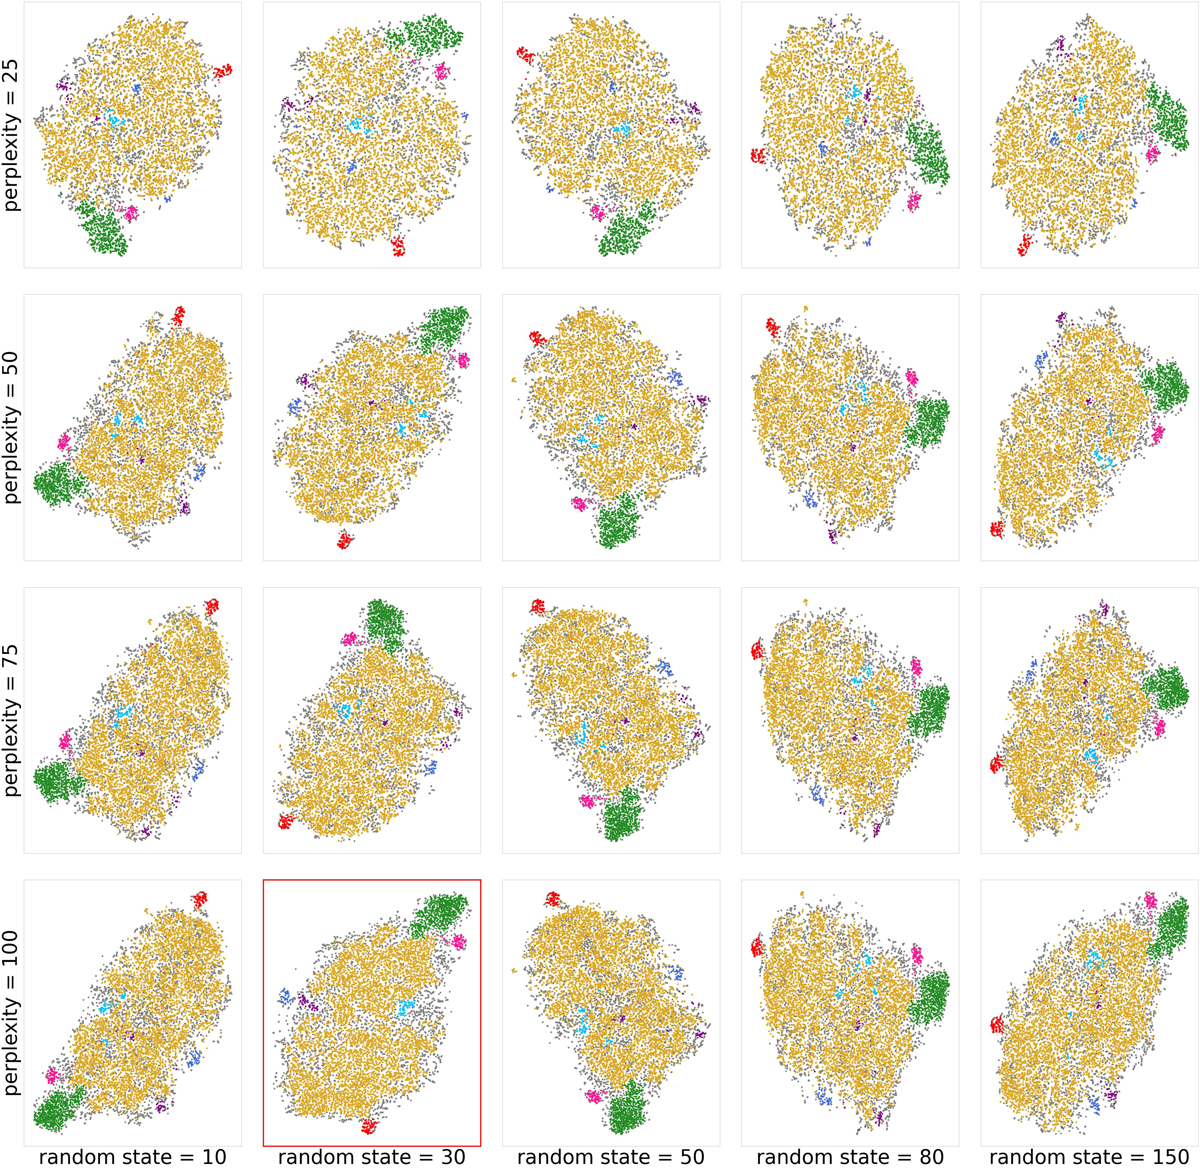
Fig. C.1.
Download original image
t-SNE projection for the GALAH DR3 SGB sample for different perplexity and random state values. The colours indicate the original groups we found previously and which are represented in Fig. 15.
Current usage metrics show cumulative count of Article Views (full-text article views including HTML views, PDF and ePub downloads, according to the available data) and Abstracts Views on Vision4Press platform.
Data correspond to usage on the plateform after 2015. The current usage metrics is available 48-96 hours after online publication and is updated daily on week days.
Initial download of the metrics may take a while.