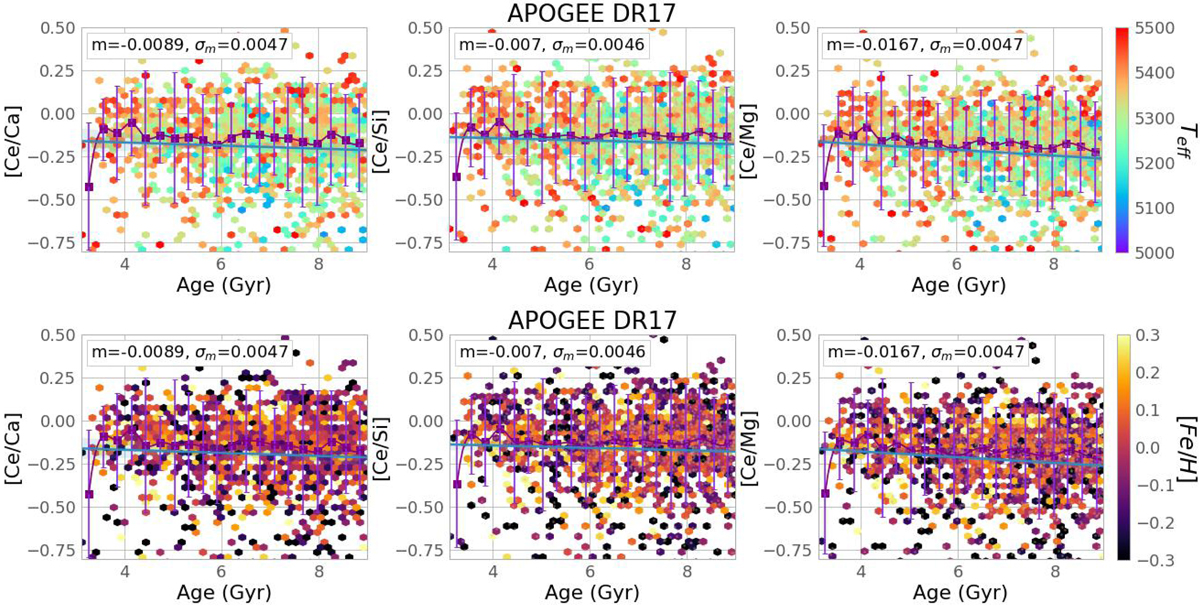
Fig. A.2.
Download original image
[s/α] abundance ratios versus age for APOGEE. The purple line shows the median abundance per age bin, and the error bar represents a one sigma deviation from the median, as in Fig. 13 but now colour-coded by temperature (upper panels) and metallicity (lower panels).
Current usage metrics show cumulative count of Article Views (full-text article views including HTML views, PDF and ePub downloads, according to the available data) and Abstracts Views on Vision4Press platform.
Data correspond to usage on the plateform after 2015. The current usage metrics is available 48-96 hours after online publication and is updated daily on week days.
Initial download of the metrics may take a while.