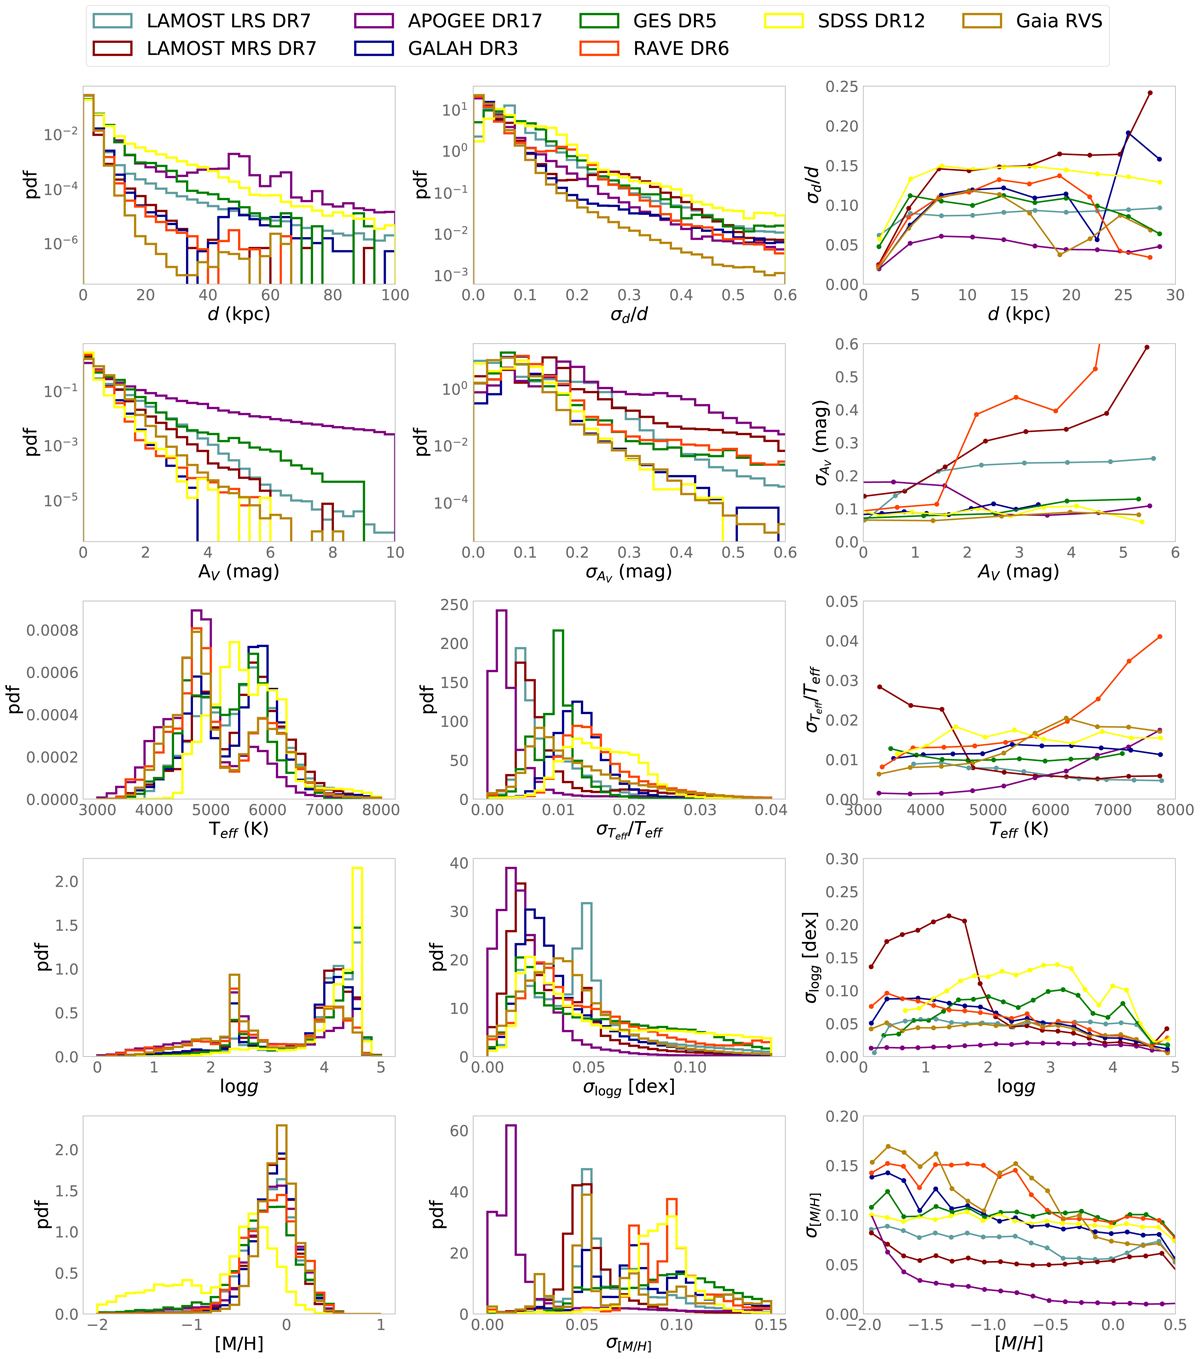
Fig. 2.
Download original image
Uncertainty distributions for StarHorse results. Left and middle panels: probability density functions of StarHorse output parameters and their respective uncertainties. The distributions are shown for each spectroscopic survey separately, as indicated in the legend. The upper panels, which show the distance and extinction, have their y-axis in logarithm scale to show the extent to larger values. Right panels: median trend of the dependence of each parameter with its associated uncertainty.
Current usage metrics show cumulative count of Article Views (full-text article views including HTML views, PDF and ePub downloads, according to the available data) and Abstracts Views on Vision4Press platform.
Data correspond to usage on the plateform after 2015. The current usage metrics is available 48-96 hours after online publication and is updated daily on week days.
Initial download of the metrics may take a while.