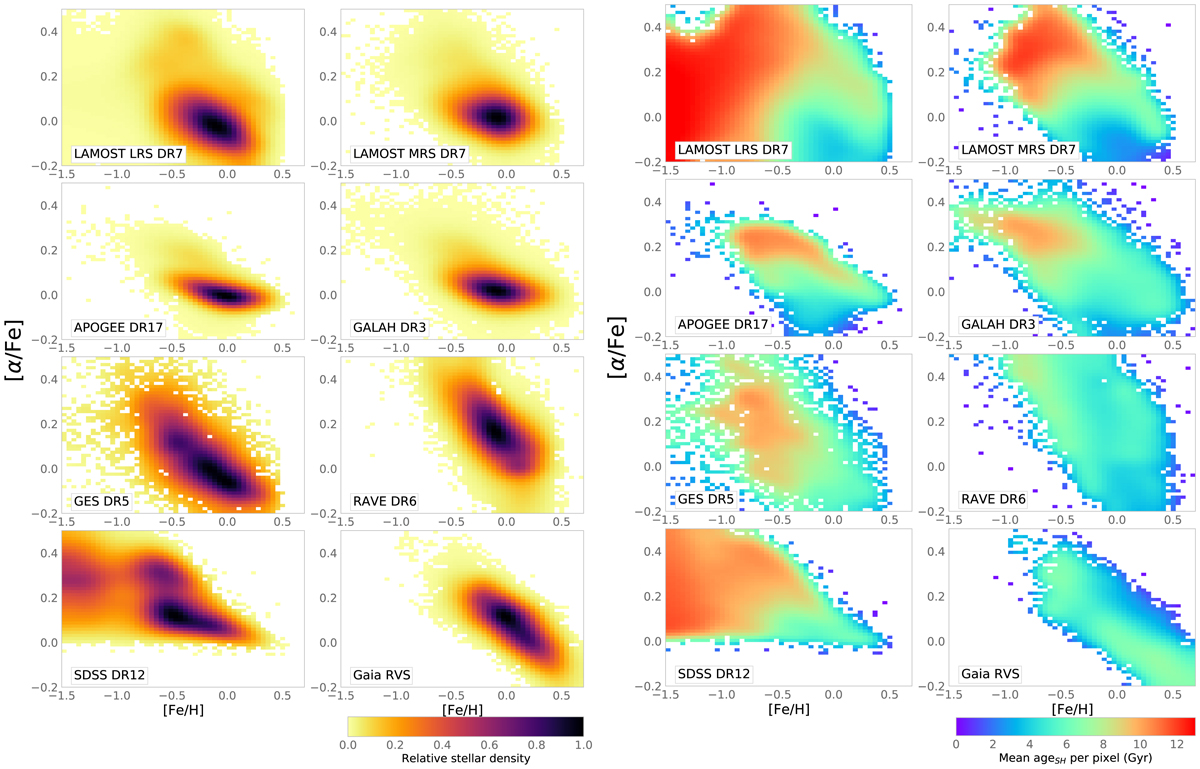
Fig. 10.
Download original image
[α/Fe] versus [Fe/H] distributions for the MSTO+SGB samples of the analysed surveys. Left: density distributions relative to the maximum count in each survey. Right: same, but coloured by the mean age per pixel.
Current usage metrics show cumulative count of Article Views (full-text article views including HTML views, PDF and ePub downloads, according to the available data) and Abstracts Views on Vision4Press platform.
Data correspond to usage on the plateform after 2015. The current usage metrics is available 48-96 hours after online publication and is updated daily on week days.
Initial download of the metrics may take a while.