Fig. 4
Download original image
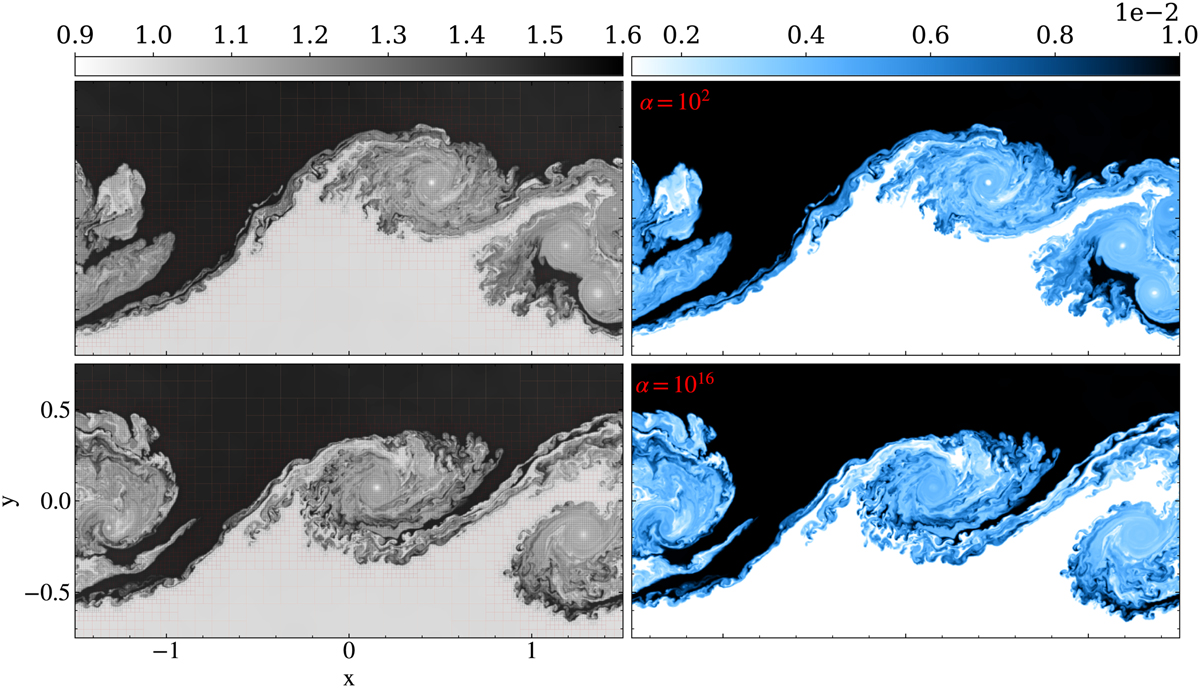
As in Fig. 3, but this time in a coupled gas-dust evolution, at time t = 40, with one species of dust experiencing linear drag. In the top row, αdrag = 102, and the bottom row shows a much stronger drag coupling, αdrag = 1016. Left column: gas density. Right column: Dust density. The limiter used was wenozp5. An animation is provided online.
Current usage metrics show cumulative count of Article Views (full-text article views including HTML views, PDF and ePub downloads, according to the available data) and Abstracts Views on Vision4Press platform.
Data correspond to usage on the plateform after 2015. The current usage metrics is available 48-96 hours after online publication and is updated daily on week days.
Initial download of the metrics may take a while.