Fig. 3
Download original image
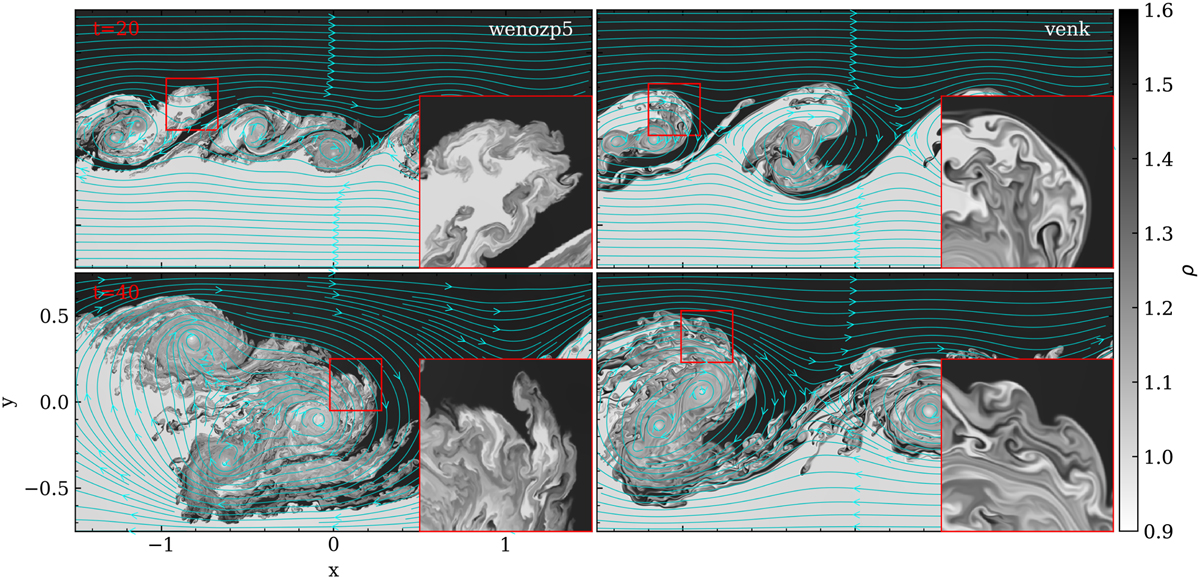
Purely HD simulations of a 2D KH shear layer. The two runs start from the same initial condition and only deviate due to the use of two different limiters in the center-to-face reconstructions: wenozp5 (left column) and venk (right column). We show density views at times t = 20 (top row) and t= 40 (bottom row). The flow streamlines plotted here are computed by MPI-AMRVAC with its internal field line tracing functionality through the AMR hierarchy, as explained in Sect. 7.2. Insets show zoomed in views of the density variations in the red boxes, as indicated. An animation is provided online.
Current usage metrics show cumulative count of Article Views (full-text article views including HTML views, PDF and ePub downloads, according to the available data) and Abstracts Views on Vision4Press platform.
Data correspond to usage on the plateform after 2015. The current usage metrics is available 48-96 hours after online publication and is updated daily on week days.
Initial download of the metrics may take a while.