Fig. 19
Download original image
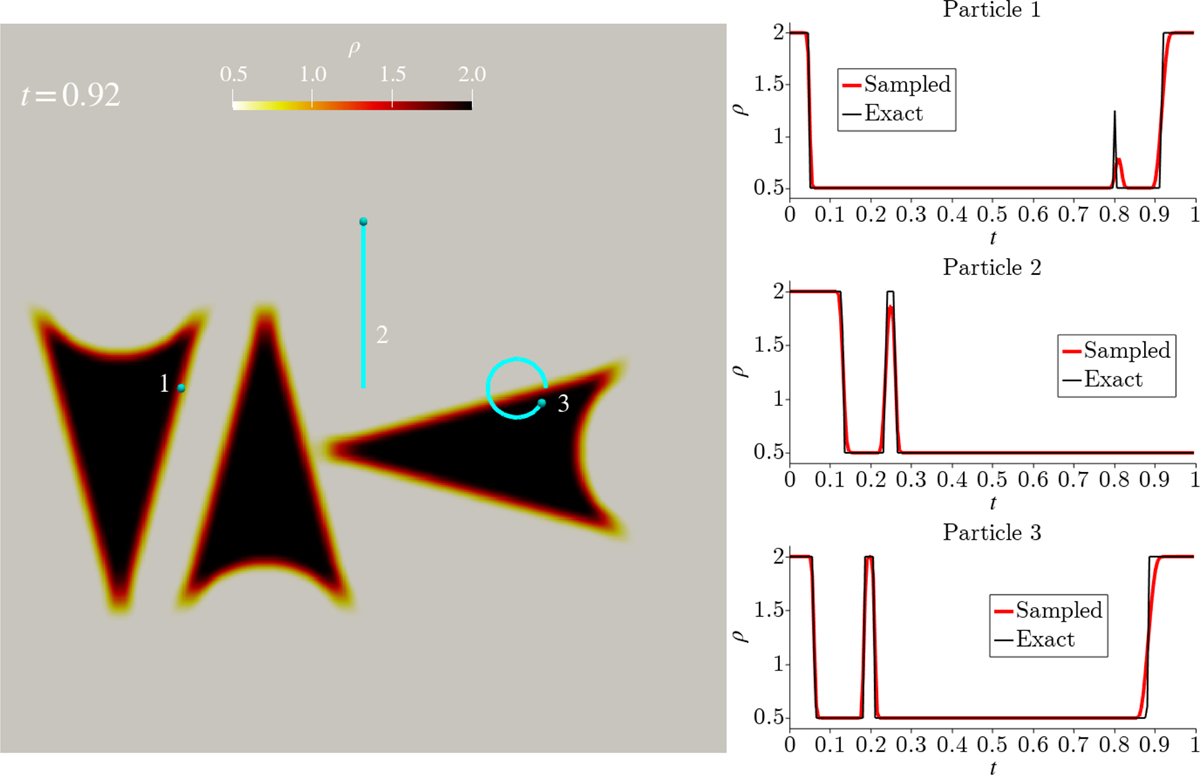
Demonstration of the sampling possibilities, where a 2D scalar linear advection problem is augmented with sampled solutions at three locations that follow user-specified orbits. The left panel shows the solution at t = 0.92, along with the trajectories of sampling particles (blue spheres and lines). The right panels show the numerical (in red) and the analytic solution (black) as a function of time for the three locations. An animation is provided online.
Current usage metrics show cumulative count of Article Views (full-text article views including HTML views, PDF and ePub downloads, according to the available data) and Abstracts Views on Vision4Press platform.
Data correspond to usage on the plateform after 2015. The current usage metrics is available 48-96 hours after online publication and is updated daily on week days.
Initial download of the metrics may take a while.