Fig. 18
Download original image
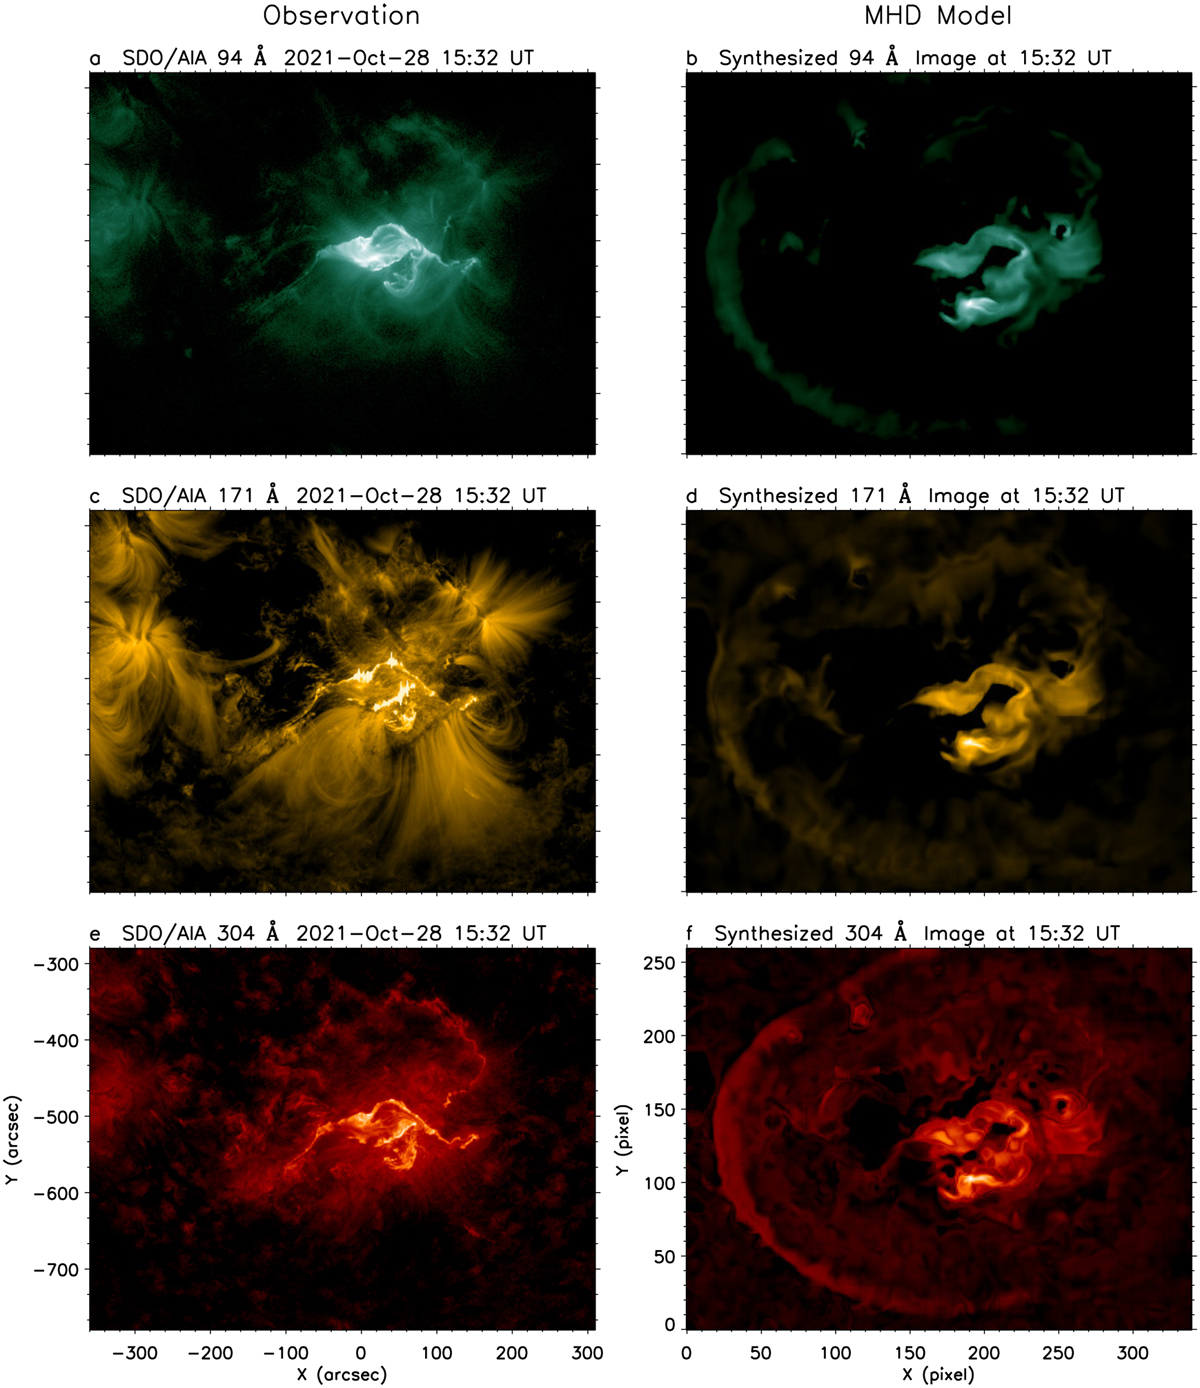
Comparison between SDO/AIA observations and synthesized EUV images from a data-driven MHD model (as in Fig. 17), including a full energy treatment. The left column shows the SDO/AIA observations at wavebands of (a) 94 Å, (c) 171 Å, and (e) 304 Å. The right column shows the emission at the same waveband as the left synthesized from the MHD model at the same time.
Current usage metrics show cumulative count of Article Views (full-text article views including HTML views, PDF and ePub downloads, according to the available data) and Abstracts Views on Vision4Press platform.
Data correspond to usage on the plateform after 2015. The current usage metrics is available 48-96 hours after online publication and is updated daily on week days.
Initial download of the metrics may take a while.