Fig. 7
Download original image
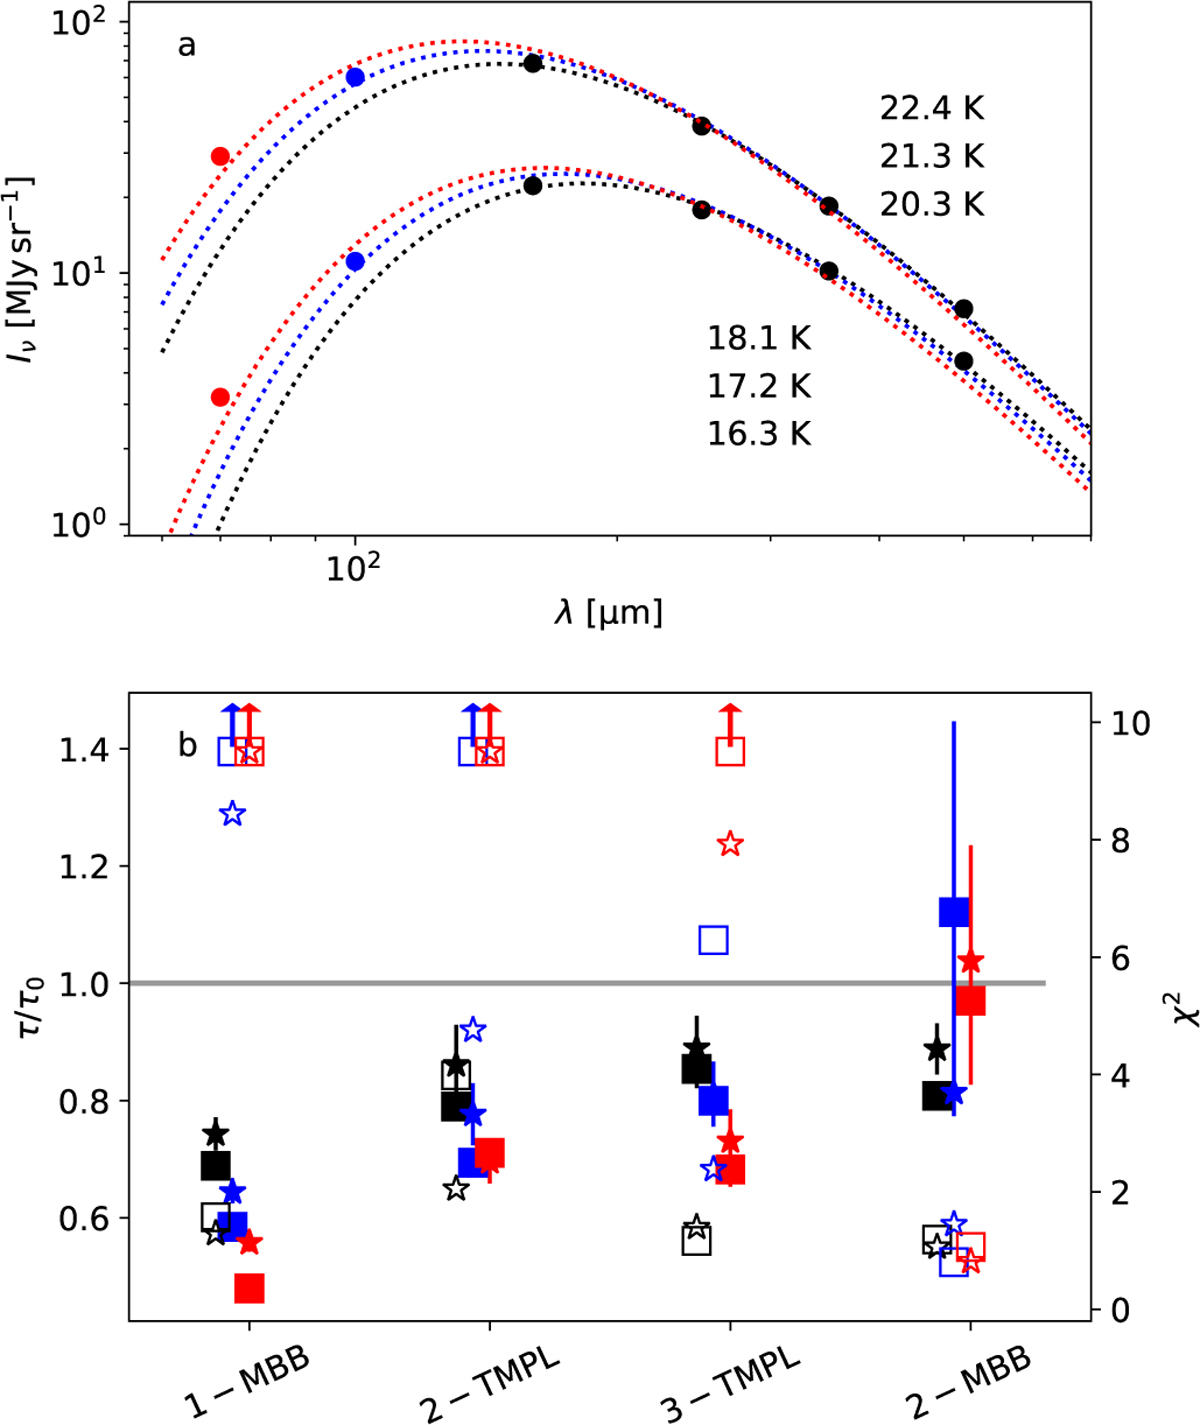
SED fits of the filament models. Frame a shows the SEDs towards the map centre and the 1-MBB fits to the 4–6 longest wavelength bands. The lower set of symbols and curves corresponds to a model without a point source, and the upper ones to a model with a point source on the LOS towards the filament but at 0.93 pc in front of the filament. The colour temperatures of the 1-MBB fits are quoted in the frame. Frame b shows the ratio of recovered and true peak optical depths (left axis, filled symbols) and the average χ2 per data point over the whole map (right axis, open symbols). The x-axis indicates the four models. The square and star symbols are, respectively, for the externally heated model and the model with a point source. The black, blue, and red symbols correspond to fits that extend to shortest wavelengths of 160, 100, and 70 μm, respectively. The error bars show the standard deviation of the optical depth estimates along the filament spine.
Current usage metrics show cumulative count of Article Views (full-text article views including HTML views, PDF and ePub downloads, according to the available data) and Abstracts Views on Vision4Press platform.
Data correspond to usage on the plateform after 2015. The current usage metrics is available 48-96 hours after online publication and is updated daily on week days.
Initial download of the metrics may take a while.