Fig. 5

Download original image
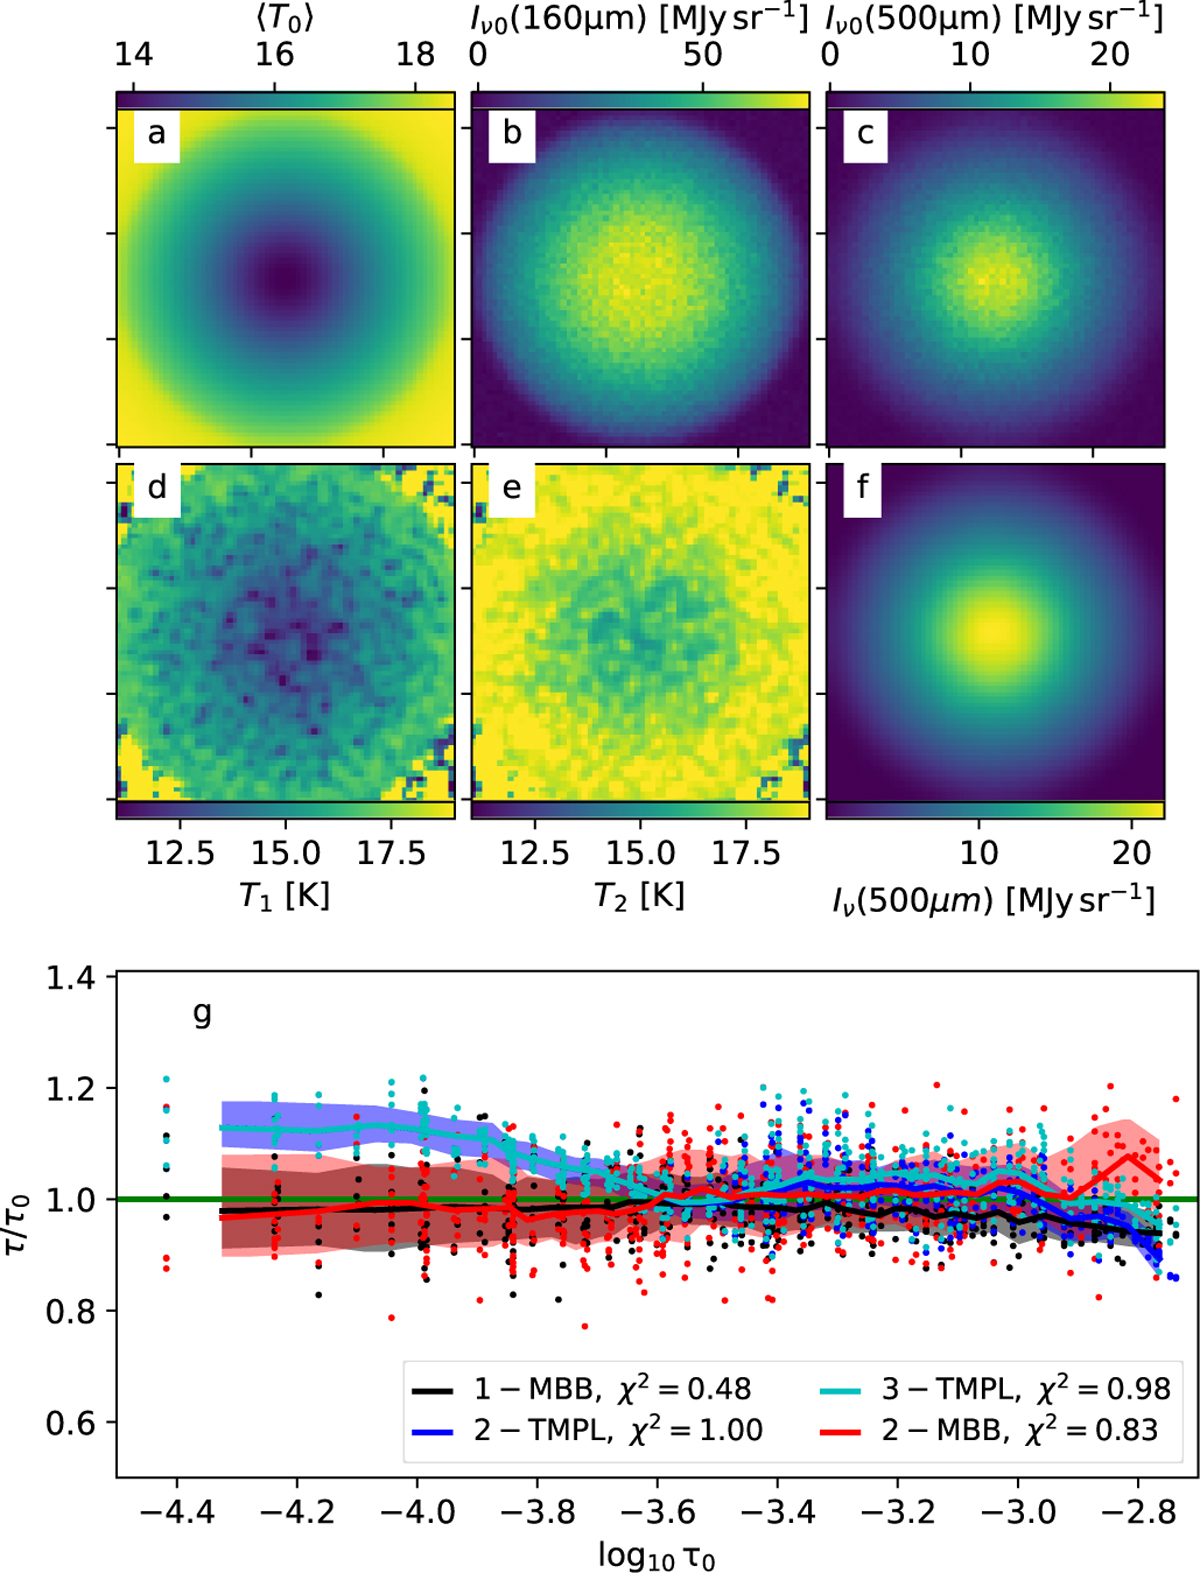
Fits on synthetic observations of an externally heated Bonnor-Ebert sphere. Frames a–c show the mass-weighted average LOS temperature of the model cloud and the calculated 160 μm and 500 μm surface brightness maps. Frames d-e show the temperature maps and frame f shows the 500 μm predictions from the 2-MBB model. Frame g shows the ratio of the estimated and true optical depth (τ/τ0) as the function of τ0 for the four cases listed in the legend. The solid lines are moving averages, the shaded regions indicate the 1-σ interval in the τ/τ0 values, and the individual pixels outside this interval are shown as dots.
Current usage metrics show cumulative count of Article Views (full-text article views including HTML views, PDF and ePub downloads, according to the available data) and Abstracts Views on Vision4Press platform.
Data correspond to usage on the plateform after 2015. The current usage metrics is available 48-96 hours after online publication and is updated daily on week days.
Initial download of the metrics may take a while.


