Open Access
Fig. D.3
Download original image
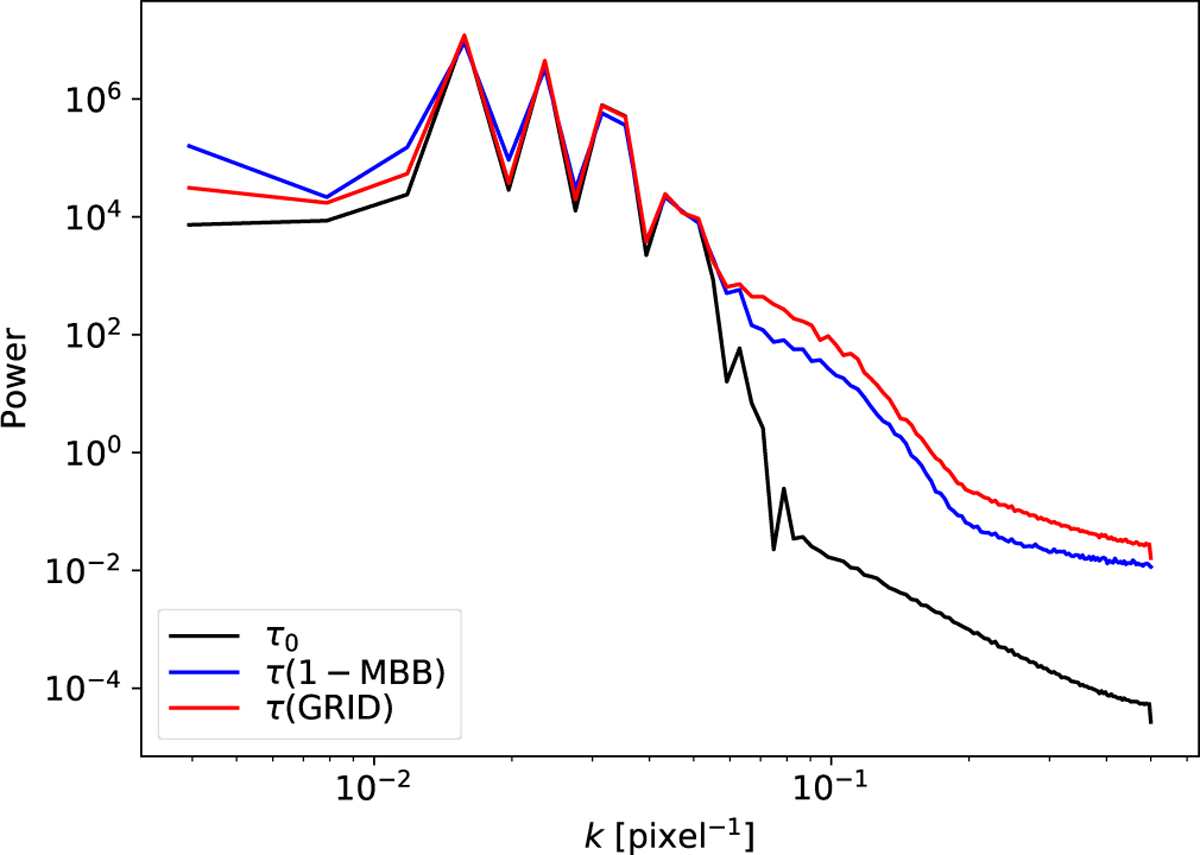
Power spectra of the optical depth maps for the fits in Fig. D.1. The spectra are shown for the true optical depth τ0 and the 1-MBB and GRID estimates. For the comparison, the other maps are convolved to the resolution of the 1-MBB map.
Current usage metrics show cumulative count of Article Views (full-text article views including HTML views, PDF and ePub downloads, according to the available data) and Abstracts Views on Vision4Press platform.
Data correspond to usage on the plateform after 2015. The current usage metrics is available 48-96 hours after online publication and is updated daily on week days.
Initial download of the metrics may take a while.