Fig. D.2
Download original image
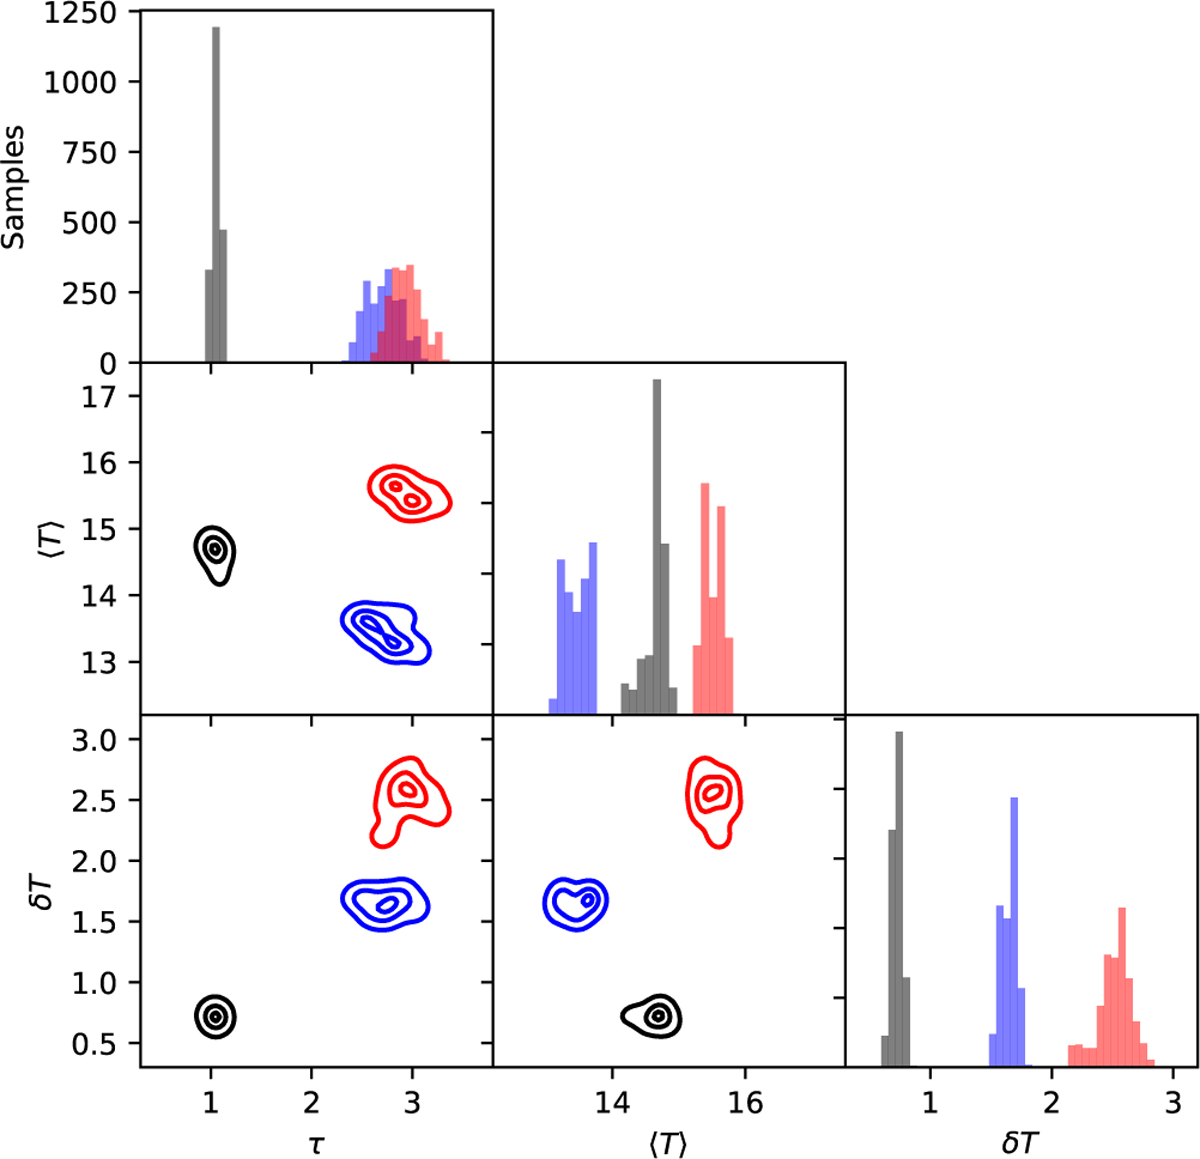
Corner plot showing parameter correlations for three areas in the fits of Fig. D.1. The parameters are the optical depth τ, the mean temperature TC, and the standard deviation of the temperature distribution δΤC. The data correspond to averages over 3 × 3 pixels towards the centre of the coldest source (blue), a position in the 15 Κ background (black), and the centre of the warmest source (red colour). The contours are drawn at 10%, 50%, and 90% of the peak probability density.
Current usage metrics show cumulative count of Article Views (full-text article views including HTML views, PDF and ePub downloads, according to the available data) and Abstracts Views on Vision4Press platform.
Data correspond to usage on the plateform after 2015. The current usage metrics is available 48-96 hours after online publication and is updated daily on week days.
Initial download of the metrics may take a while.