Fig. C.2
Download original image
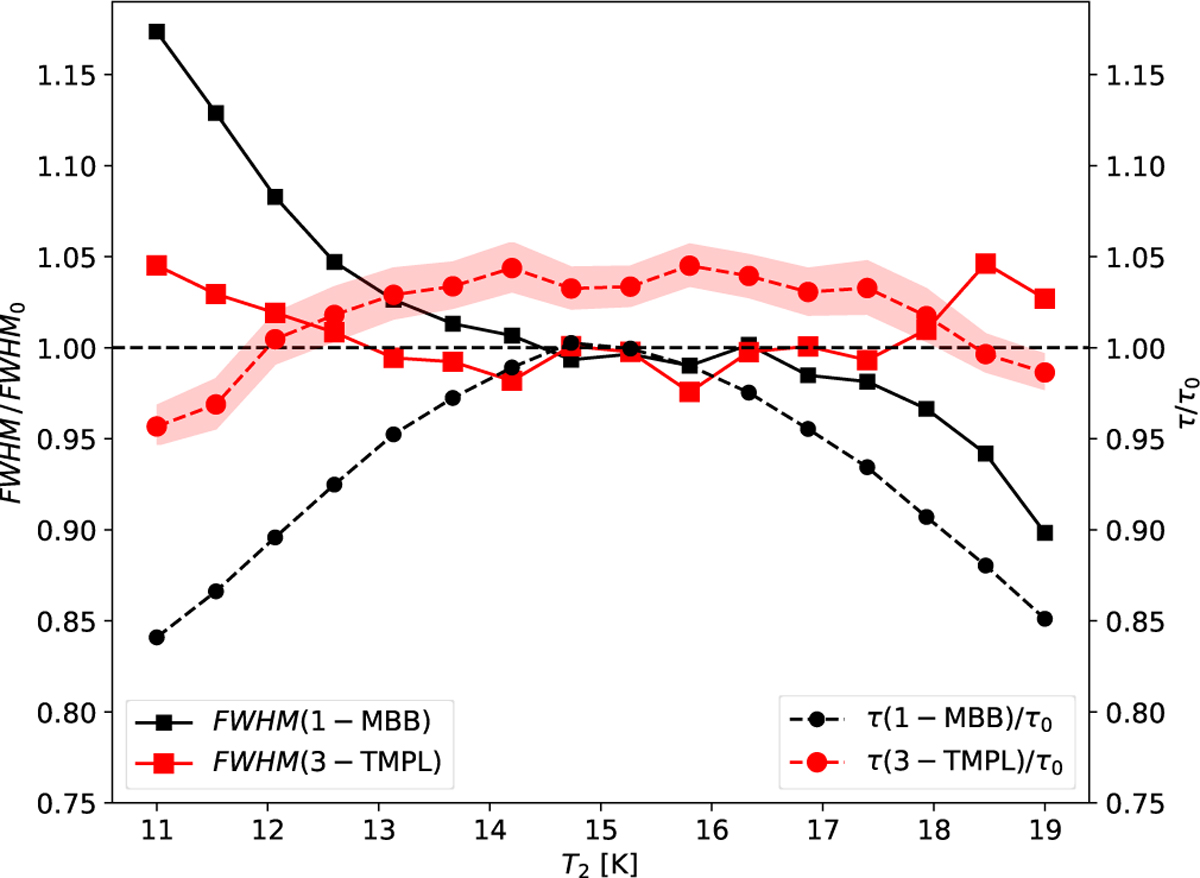
Test with sources with radial temperature gradients. The average optical depth estimates (circles) and the source FWHM estimates (squares) are plotted relative to their correct values. The symbols correspond to 16 sources that are plotted against their central temperature T2. The 1-MBB and the 3-TMPL results are plotted in black and red. respectively. The shading shows the MCMC error estimates for the τ/τ0 ratio in the 3-TMPL fits.
Current usage metrics show cumulative count of Article Views (full-text article views including HTML views, PDF and ePub downloads, according to the available data) and Abstracts Views on Vision4Press platform.
Data correspond to usage on the plateform after 2015. The current usage metrics is available 48-96 hours after online publication and is updated daily on week days.
Initial download of the metrics may take a while.