Fig. C.1
Download original image
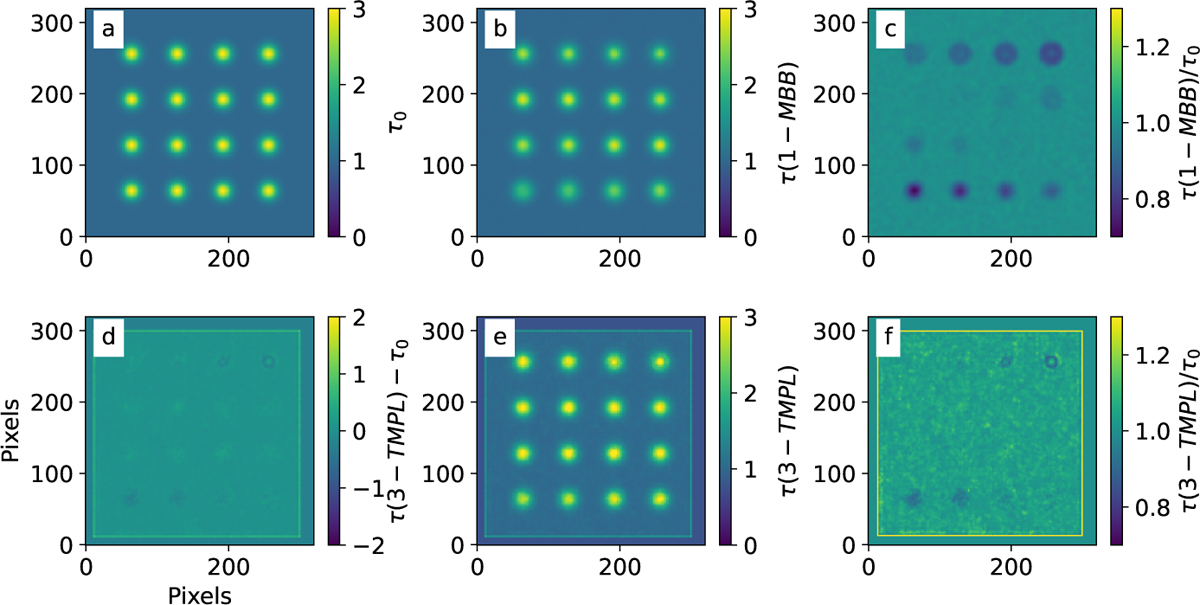
Fits of 1-MBB and 3-TMPL models to maps containing 16 Gaussian sources with different radial temperature gradients. The upper frames show the true value τ0 (frame a), the 1-MBB estimates (frame b), and the ratio of the 1-MBB estimates divided by the true values (frame c). Data in frames b-c have a resolution of 6.1 pixels. The lower frames show results of the 3-TMPL fit: the fit residuals (frame d), the estimated τ values (frame e), and the ratio of the 3-TMPL estimates and the true values (frame f). The nominal resolution in the lower maps is equal to 3 pixels.
Current usage metrics show cumulative count of Article Views (full-text article views including HTML views, PDF and ePub downloads, according to the available data) and Abstracts Views on Vision4Press platform.
Data correspond to usage on the plateform after 2015. The current usage metrics is available 48-96 hours after online publication and is updated daily on week days.
Initial download of the metrics may take a while.